1 Introduction
Model diagnostics are critical in evaluating the accuracy and validity of a statistical model. In the context of regression diagnostics, a common practice is to plot residuals against fitted values, which serves as a starting point for evaluating the adequacy of the fit and verifying the underlying assumptions. Visual diagnostics are frequently preferred or recommended (Cook and Weisberg 1982; Draper and Smith 1998; Montgomery et al. 1982) due to the possibility of discovering abstract and unquantifiable insights, however, it can be subject to over-interpretation or even neglect.
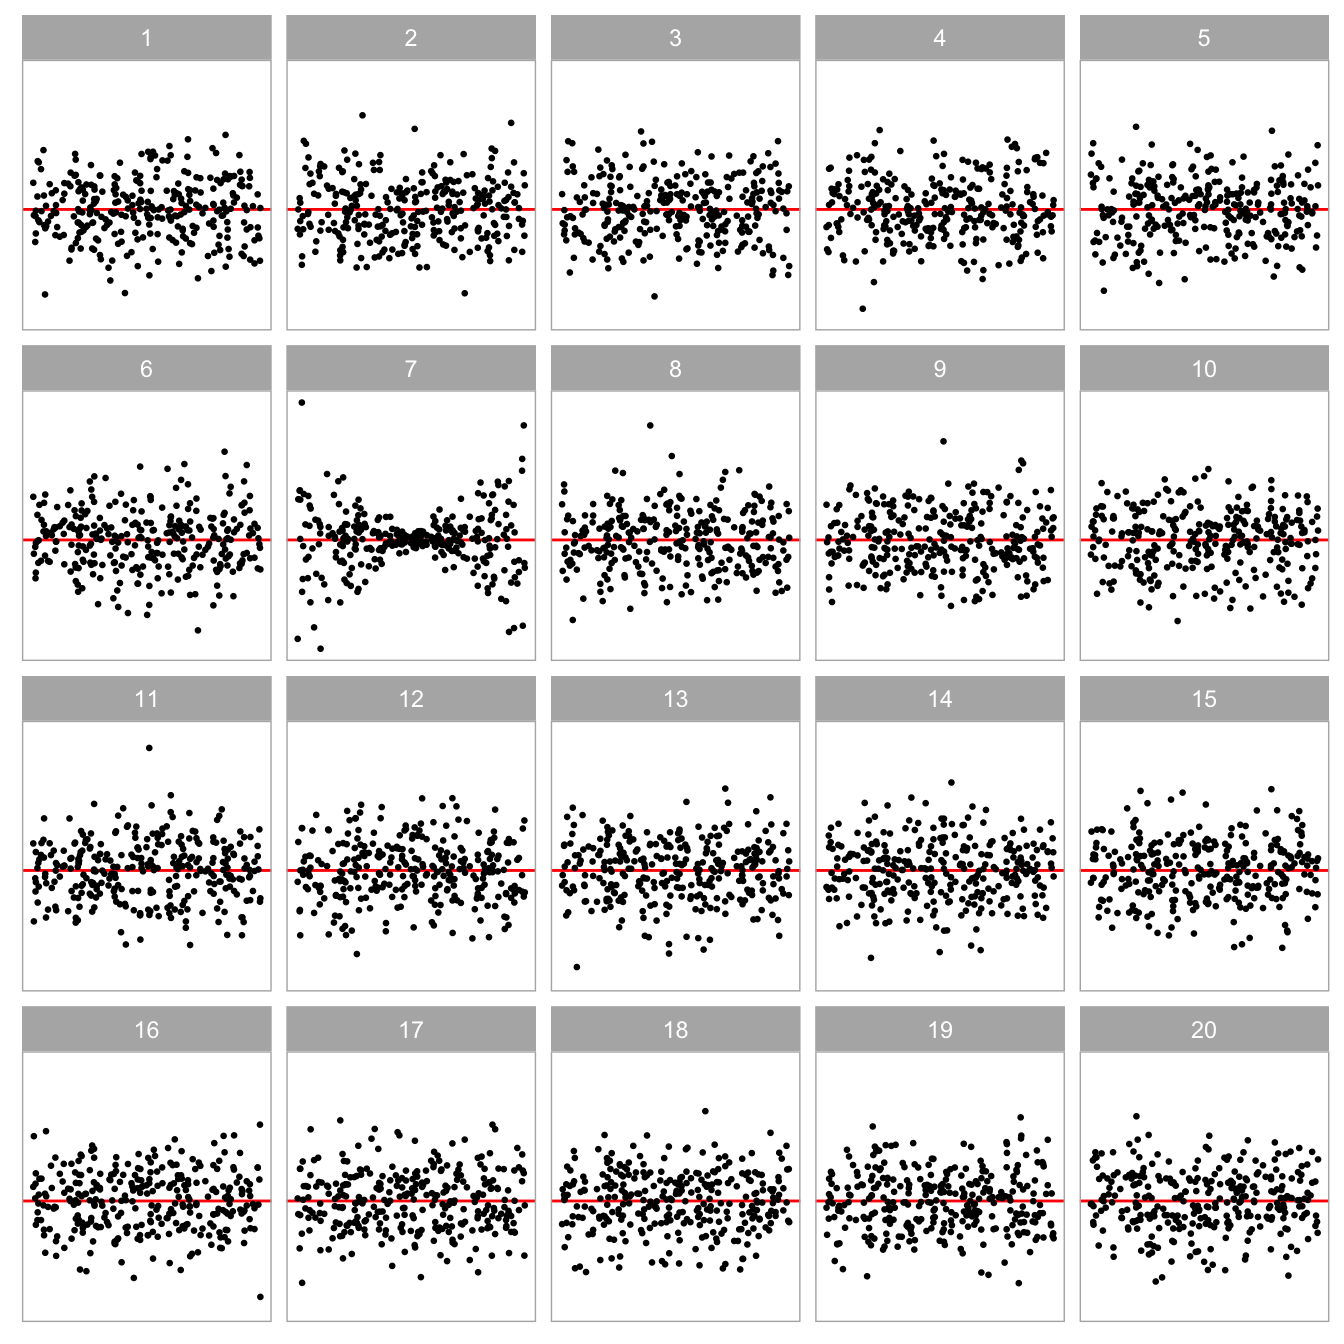
Buja et al. (2009) introduced a visual inference framework that formalised a hypothesis testing of graphical representations of data (henceforth referred to as the data plot) via the lineup protocol (see Figure 1.1 for an example). The protocol is inspired by the police lineup technique employed in eyewitness identification of criminal suspects. Briefly, the protocol comprises m randomly positioned plots, where one position presents the data plot, while the remaining m-1 plots present the plots with the same graphical structure, except that the data has been replaced with data consistent with the null hypothesis H_0 (henceforth referred to as null plots). To compute the p-value of the visual test, the lineup will be independently presented to a number of participants, asking them to pick the most different plot. Under H_0, the data plot is expected to be indistinguishable from the null plots, and the probability of correctly identifying the data plot by an observer is 1/m. If a large number of participants correctly identify the data plot, the corresponding p-value will be small, indicating strong evidence against H_0. This protocol provides a calibration of the data plot against the null plots, ensuring that the data plot is not over-interpreted.
The lineup protocol has gained increasing traction in recent years and has already been integrated into data analysis of various topics (see Krishnan and Hofmann 2021; Loy and Hofmann 2013; Savvides et al. 2023; Widen et al. 2016). However, the reliance of human assessment is a fundamental aspect of visual tests, which may restrict its widespread usage. The lineup protocol is unsuitable for large-scale applications, due to its high labour costs and time requirements. Moreover, it presents significant usability issues for individuals with visual impairments, resulting in reduced accessibility.
To address these limitations, this thesis proposes a computer vision-based approach to automate the visual inference process for assessment of linear regression residual plots. Modern computer vision models often use a convolutional neural network to process digital images to perform various tasks (e.g. object detection, object identification and signal processing). The development for computer vision models has primarily focused on processing natural images, such as photographs and videos, and its adaptation for data plots has some success (e.g. classification of time series images in Hatami et al. 2018) but generally limited in development. The development of computer vision models for the assessment of residual plots will make the process more efficient, consistent, and accessible.
Regression diagnostics is a well-established field with extensive literature, and a more detailed discussion will be provided in Chapter 2. This field also encompasses a variety of regression models, including generalized linear models (Hardin and Hilbe 2007), mixed-effects models (Pinheiro and Bates 2006), panel data models (Baltagi and Baltagi 2008), and survival models (Baltagi and Baltagi 2008). This thesis, however, focuses on the classical normal linear regression model. Further discussions on extending the methods established in this thesis to other types of regression models are provided in Section 3.12.
1.1 Thesis Outline
The thesis is structured as follows.
Chapter 2 provides empirical evidence supporting the indispensability of residual plots through a visual inference experiment using the lineup protocol. By comparing human evaluations of residual plots to conventional statistical tests, this chapter demonstrates the advantages of graphical methods in detecting practical issues with model fit, while also highlighting the limitations of conventional tests in producing overly sensitive results. The chapter contains a comprehensive literature review related to residual diagnostics.
Chapter 3 introduces a computer vision model to automate the assessment of residual plots, addressing the scalability limitations of human-based visual inference. This model is trained to predict a distance measure based on Kullback-Leibler divergence, quantifying the disparity between the residual distribution of a fitted classical normal linear regression model and the reference distribution. Performance of the model is evaluated on the human subject experiment data collected in Chapter 2. A comprehensive literature review of data plots reading with computer vision models is contained in the chapter.
Chapter 4 introduces a new R package, autovi, and its accompanying web interface, autovi.web, designed to automate the assessment of residual plots in regression analysis. The package uses a computer vision model built in Chapter 3 to predict a measure of visual signal strength (VSS) and provides supporting information to assist analysts in diagnosing model fit. By automating this process, autovi and autovi.web improve the efficiency and consistency of model evaluation, making advanced diagnostic tools accessible to a broader audience.
Chapter 5 summarises the contribution of the work and the (potential) impact, and discusses some future plans.