4  Software for Automated Residual Plot Assessment: autovi and autovi.web

Regression software is widely available today, but tools for effective diagnostics are still lagging. Perhaps, one of the reasons is that it is hard. Conventional tests, that would make the task easy, are often too sensitive, which would result in adequate models being abandoned if the analyst strictly adhered to the test decision. The recommended advice is to have the analyst assess the strength of patterns in residual plots. This requires human effort and also suffers from the potential for inconsistent decisions from different analysts. Using a lineup protocol can help to alleviate inconsistency, but requires even more human effort. This is the type of task where a robot might be employed to do the disagreeable work that currently requires a human. Here we describe a new R package that includes a computer vision model for automated assessment of residual plots, and an accompanying Shiny app for ease of use. For a user-provided sample of residuals, it predicts a measure of visual signal strength (VSS) and provides a suite of supporting information to assist the analyst diagnose their model fit.

4.1 Introduction

Regression analysis is a fundamental statistical technique widely used for modeling data from many fields. To diagnose the fit of a model it is recommended that the residuals are plotted. If the fit is good, any variation remaining should be noise, consistent with sampling from a distribution specified by the error model. Deviations that might be observed from a residual plot are non-normality, heteroscedasticity, and other associations with the fitted values. Chapter 2 established that visual methods for assessing residuals are superior to conventional testing in that they are not so sensitive to small departures. Chapter 3 provides a computer vision model to alleviate the human labor needed to visually assessing residual plots. The next step is to deliver the use of the computer vision model to potential users, so that it can be widely used to the benefit of the analytics community.

Software for regression analysis tools is widely available. The Comprehensive R Archive Network (CRAN) (Hornik 2012) hosts a vast array of packages, many of which provide tools to diagnose models using residual plots. These packages can be broadly categorized into three groups: general purpose, enhanced diagnostics, diagnostics with statistical testing.

General-purpose regression analysis tools are the largest and most commonly used group. These packages are not specifically designed for graphical diagnostics of residuals in linear regression but offer this functionality as part of a broader set of statistical tools. These include the stats package (R Core Team 2022), which includes common diagnostic plots like residuals vs fitted values, quantile-quantile (Q-Q) plots, and residuals vs leverage plots. Other packages such as jtools (Long 2022), olsrr (Hebbali 2024), rockchalk (Johnson 2022), and ggResidpanel (Goode and Rey 2019) provide similar graphical tools with alternative aesthetic styles or interactive features. They all fundamentally deliver diagnostic plots as outlined in the classic text Cook and Weisberg (1982). As noted in Li et al. (2024), relying solely on subjective assessments of data plots can lead to problems, such as over-interpreting random patterns as model violations.

Enhanced visual diagnostics forms the second group, which offer advanced visual aids for interpreting diagnostic plots. This includes ecostats (Warton 2023), which adds simulation envelopes to residual plots, and DHARMa (Hartig 2022), which compares the empirical 0.25, 0.5, and 0.75 quantiles in scaled residuals with their theoretical counterparts. DHARMa’s focus is detecting model violations such as heteroscedasticity and incorrect functional forms, and uncovering issues specific to generalized linear models and mixed-effect models, like over/under-dispersion. It also adds results from conventional tests as annotations, labels, or text within the plot, to assist in avoiding misinterpretation.

Statistical testing for visual discoveries is the third group, which focuses on providing tools for conducting formal statistical tests for visual discoveries obtained from diagnostic plots (Buja et al. 2009). Packages include the nullabor (Wickham et al. 2020) HLMdiag (Loy and Hofmann 2014) and regressinator (Reinhart 2024). These enables users to compare the actual residual plot with samples from null distributions, and can help quantify the significance of patterns.

However, as discussed in Chapter 3, the lineup protocol has significant limitations in large-scale applications due dependence on human labor. Thus a computer vision model was developed with an associated statistical testing procedure to automate the assessment of residual plots. This model takes a residual plot and a vector of auxiliary variables (such as the number of observations) as inputs and outputs the predicted visual signal strength (VSS). This strength estimates the distance between the residual distribution of the fitted regression model and the reference distribution assumed under correct model specification.

To make the statistical testing procedure and trained computer vision model widely accessible, we developed the R package autovi, and a web interface, autovi.web to make it easy for users to automatically read their residual plots with the trained computer vision model.

The remainder of this chapter is structured as follows: Section 4.2 provides a detailed documentation of the autovi package, including its usage and infrastructure. Section 4.3 focuses on the autovi.web interface, describing its design and usage, along with illustrative examples. Finally, Section 4.4 presents the main conclusions of this work.

4.2 R package: autovi

The main purpose of autovi is to provide rejection decisions and p-values for testing whether a regression model is correctly specified. The package introduces a novel approach to automating statistical analysis, particularly in the interpretation of residual plots. The name autovi stands for automated visual inference. While initially designed for linear regression residual diagnostics, it has the potential to be extended to broader visual inference applications, as we discuss in section Section 4.2.4.

4.2.1 Implementation

The package autovi is built upon the bandicoot object-oriented programming (OOP) system (Li 2024), which marks a departure from R’s conventional S3 generic system. The adoption of an OOP architecture enhances flexibility and modularity, enabling users to redefine key functions within the infrastructure through method overriding. While similar functionality could be replicated using R’s S3 system with generic functions, the OOP system offers a more structured and extensible foundation for the package.

The infrastructure of autovi demonstrates the effective integration of multiple programming languages and libraries to create a comprehensive analytical tool. It depends on five core libraries from Python and R, each contributing critically to the analysis pipeline. In Python, pillow (Clark et al. 2015) handles image processing tasks, including reading PNG files of residual plots, resizing them, and converting them into input tensors for further analysis. The TensorFlow (Abadi et al. 2016) library, a cornerstone of contemporary machine learning, is employed to predict the VSS of these residual plots, utilizing a pre-trained convolutional neural network.

Within the R environment, autovi utilizes several libraries. ggplot2 (Wickham 2016) is employed to generate the initial residual plots, which are then saved as PNG files, using as the primary visual input for the analysis. The cassowaryr (Mason et al. 2022) library calculates scagnostics (scatter plot diagnostics) of the residual plots, providing numerical features that capture various statistical properties of the plots. These scagnostics complement the visual analysis by supplying quantitative metrics as secondary input to the computer vision model. The reticulate (Ushey et al. 2024) package is used to bridge R and Python, allowing for seamless communication between the two languages and supporting an integrated infrastructure.

4.2.2 Installation

The autovi package is available on CRAN. It is actively developed and maintained, with the latest updates accessible on GitHub at https://github.com/TengMCing/autovi. The code discussed in this chapter is based on autovi version 0.4.1.

The package includes internal functions to check the current Python environment used by the reticulate package. If the necessary Python packages are not installed in the Python interpreter, an error will be raised. If you want to select a specific Python environment, you can do so by calling the reticulate::use_python() function before using the autovi package.

4.2.3 Usage

To get started quickly, only calls three functions are necessary to obtain a summary of the automated residual assessment:

library(autovi) 
checker <- residual_checker(fitted_model = lm(dist ~ speed, data = cars))
checker$check() 
── <AUTO_VI object>
Status:
 - Fitted model: lm
 - Keras model: UNKNOWN
    - Output node index: 1
 - Result:
    - Observed visual signal strength: 3.162 (p-value = 0.0396)
    - Null visual signal strength: [100 draws]
       - Mean: 1.274
       - Quantiles: 
          ╔═════════════════════════════════════════════════╗
          ║   25%    50%    75%    80%    90%    95%    99% ║
          ║0.8021 1.1109 1.5751 1.6656 1.9199 2.6564 3.3491 ║
          ╚═════════════════════════════════════════════════╝
    - Bootstrapped visual signal strength: [100 draws]
       - Mean: 2.786 (p-value = 0.05941)
       - Quantiles: 
          ╔══════════════════════════════════════════╗
          ║  25%   50%   75%   80%   90%   95%   99% ║
          ║2.452 2.925 3.173 3.285 3.463 3.505 3.652 ║
          ╚══════════════════════════════════════════╝
    - Likelihood ratio: 0.7275 (boot) / 0.06298 (null) = 11.55 
  1. Load the package using the library() function.
  2. Construct a checker with a linear regression model.
  3. Call the check() method of the checker with default arguments. This predicts the VSS for the true residual plot, 100 null plots, and 100 bootstrapped plots, storing the predictions internally. A concise report of the check results will be printed.

The summary reports key findings such as the VSS of the true residual plot and the p-value of the automated visual test. The p-value is the ratio of null plots that have VSS greater than or equal to that of the true residual plot. We typically reject the null hypothesis when the p-value is smaller than or equal to a desired significance level, such as 5%. The report also provides sample quantiles of VSS for null and bootstrapped plots, helping to explain the severity and likelihood of model violations.

Although the p-value is sufficient for automated decision-making, users can visually inspect the original residual plot alongside a sample null plot. This visual comparison can clarify why H_0 is either rejected or not, and help identify potential remedies. The plot_pair() and plot_lineup() methods facilitate this comparison.

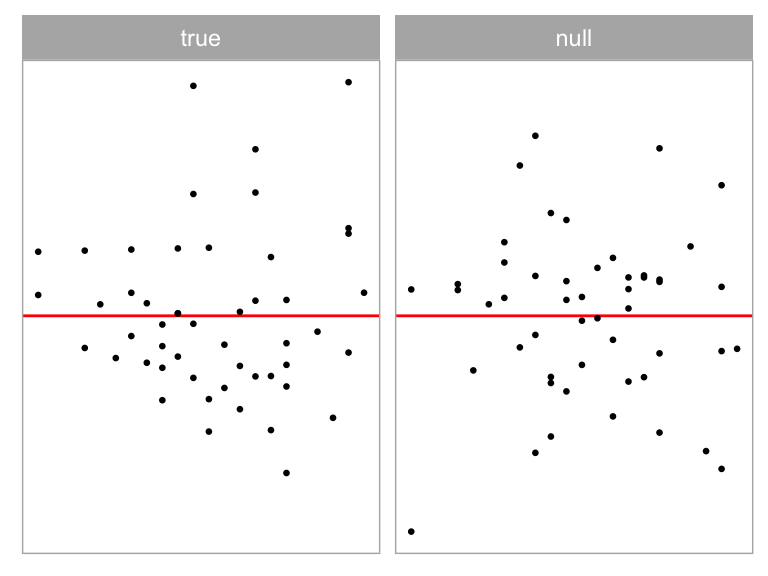
checker$plot_pair()
Figure 4.1: True plot alongside one null plot, for quick comparison.

The plot_pair() method (Figure 4.1) displays the true residual plot on the left and a single null plot on the right. If a full lineup was shown, the true residual plot would be embedded in a page of null plots. Users should look for any distinct visual patterns in the true residual plot that are absent in the null plot. Running these functions multiple times can help any visual suspicions, as each execution generates new random null plots for comparison.

The package offers a straightforward visualization of the assessment result through the summary_plot() function.

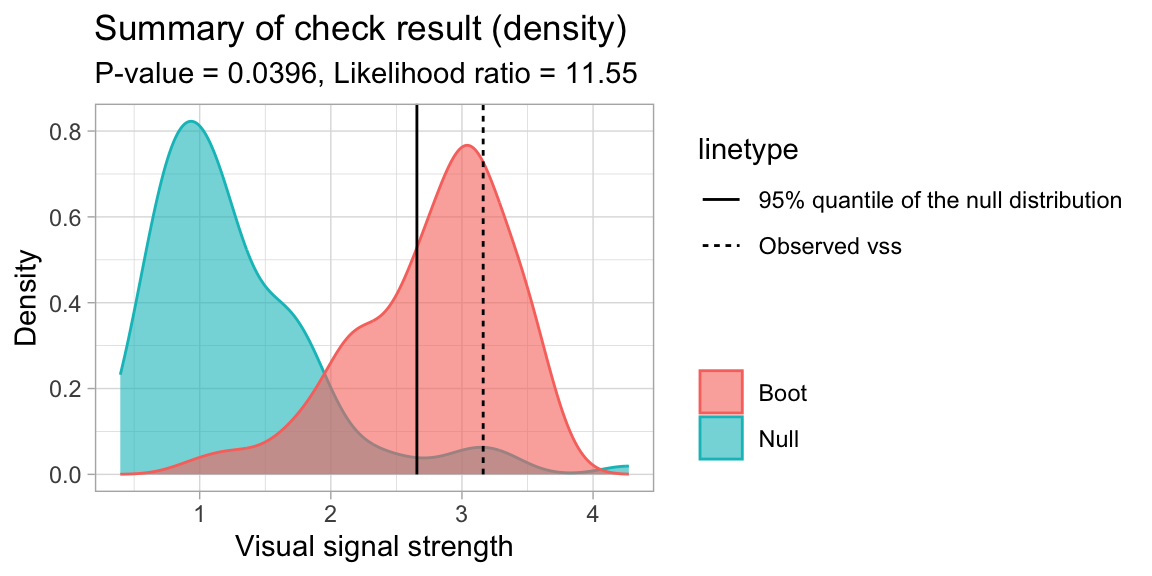
checker$summary_plot()
Figure 4.2: Summary plot comparing the densities of VSS for bootstrapped residual samples (red) relative to VSS for null plots (blue).

In the result, shown in Figure 4.2, the blue area represents the density of VSS for null residual plots, while the red area shows the density for bootstrapped residual plots. The dashed line indicates the VSS of the true residual plot, and the solid line marks the critical value at a 95% significance level. The p-value and the likelihood ratio are displayed in the subtitle. The likelihood ratio represents the ratio of the likelihood of observing the VSS of the true residual plot from the bootstrapped distribution compared to the null distribution.

Interpreting the plot involves several key aspects. If the dashed line falls to the right of the solid line, it suggests rejecting the null hypothesis. The degree of overlap between the red and blue areas indicates similarity between the true residual plot and null plots; greater overlap suggests more similarity. Lastly, the portion of the red area to the right of the solid line represents the percentage of bootstrapped models considered to have model violations.

This visual summary provides an intuitive way to assess the model’s fit and potential violations, allowing users to quickly grasp the results of the automated analysis.

4.2.4 Modularized Infrastructure

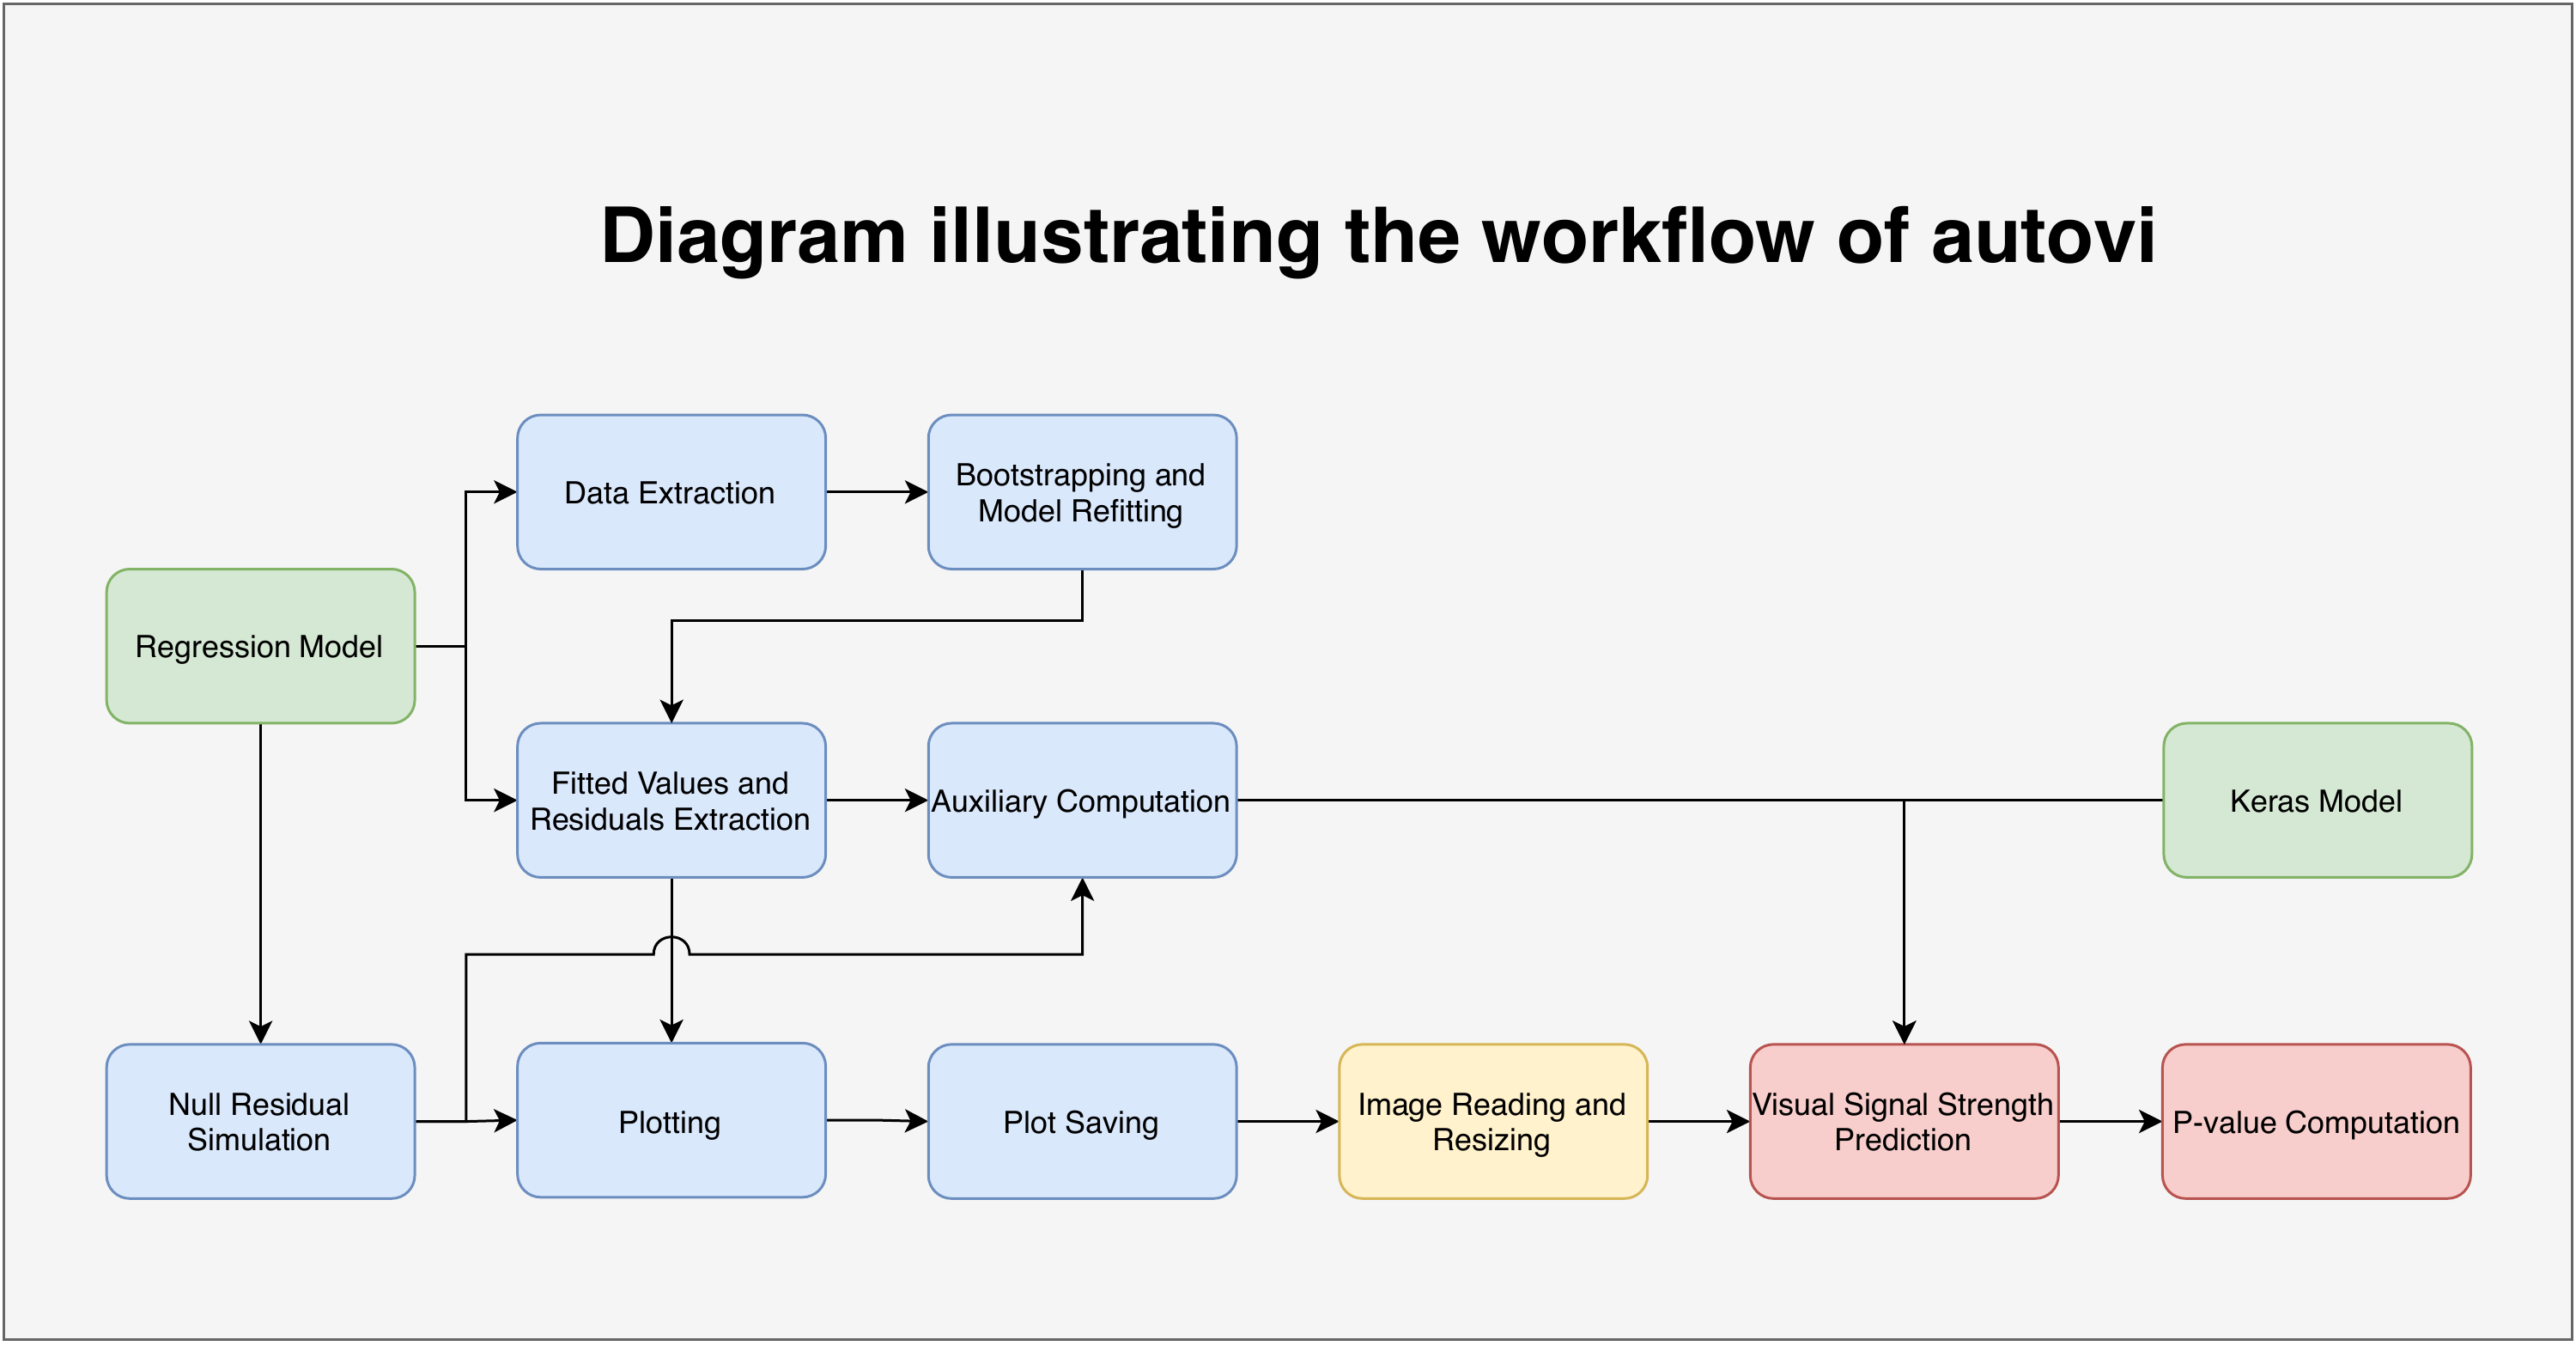
Figure 4.3: Diagram illustrating the infrastructure of the R package autovi. The modules in green are primary inputs provided by users. Modules in blue are overridable methods that can be modified to accommodate users’ specific needs. The module in yellow is a pre-defined non-overridable method. The modules in red are primary outputs of the package.

The initial motivation for developing autovi was to create a convenient interface for sharing the models described and trained in Chapter 3. However, recognizing that the classical normal linear regression model represents a restricted class of models, we sought to avoid limiting the potential for future extensions, whether by the original developers or other users. As a result, the package was designed to function seamlessly with linear regression models with minimal modification and few required arguments, while also accommodating other classes of models through partial infrastructure substitution. This modular and customizable design allows autovi to handle a wide range of residual diagnostics tasks.

The infrastructure of autovi consists of ten core modules: data extraction, bootstrapping and model refitting, fitted values and residuals extraction, auxiliary computation, null residual simulation, plotting, plot saving, image reading and resizing, VSS prediction, and p-value computation. Each module is designed with minimal dependency on the preceding modules, allowing users to customize parts of the infrastructure without affecting its overall integrity. An overview of this infrastructure is illustrated in Figure Figure 4.3.

The modules for VSS prediction and p-value computation are predefined and cannot be overridden, although users can interact with them directly through function arguments. Similarly, the image reading and resizing module is fixed but will adapt to different Keras models by checking their input shapes. The remaining seven modules are designed to be overridable, enabling users to tailor the infrastructure to their specific needs. These modules are discussed in detail in the following sections.

Initialization

An autovi checker can be initialized by supplying two primary inputs, including a regression model object, such as an lm object representing the result of a linear regression model, and a trained computer vision model compatible with the Keras (Chollet et al. 2015) Application Programming Interface (API), to the AUTO_VI class constructor auto_vi(). The residual_checker() introduced in Section 4.2.3 is a thin wrapper around auto_vi(), which will call get_keras_model() during initialization. get_keras_model() is a function to download a trained computer vision model (described in Chapter 3) from GitHub. “vss_phn_32” specifies a model that predicts VSS and is trained on residuals with polynomial, heteroskedasticity, and non-normality patterns (phn). More details about the hosted models will be provided in Section 4.2.7.

The input of the constructor will be stored in the checker and can be accessed by the user through the $ operator.

library(autovi)
checker <- auto_vi(fitted_model = lm(dist ~ speed, data = cars), 
                   keras_model = get_keras_model("vss_phn_32"))

Optionally, the user may specify the node index of the output layer of the trained computer vision model to be monitored by the checker via the node_index argument if there are multiple output nodes. This is particularly useful for multiclass classifiers when the user wants to use one of the nodes as a VSS indicator.

After initializing the object, you can print the checker to view its status.

── <AUTO_VI object>
Status:
 - Fitted model: lm
 - Keras model: (None, 32, 32, 3) + (None, 5) -> (None, 1)
    - Output node index: 1
 - Result: UNKNOWN 

The status includes the list of regression model classes (as provided by the built-in class() function), the input and output shapes of the Keras model in the standard Numpy format (Harris et al. 2020), the output node index being monitored, and the assessment result. If no check has been run yet, the assessment result will display as “UNKNOWN”.

Fitted Values and Residuals Extraction

To be able to predict VSS for a residual plot, both fitted values and residuals are needed to be extracted from the regression model object supplied by the user. In R, statistical models like lm (linear model) and glm (generalized linear model) typically support the use of generic functions such as fitted() and resid() to retrieve these values. The get_fitted_and_resid() method, called by the checker, relies on these generic functions by default. However, generic functions only work with classes that have appropriate method implementations. Some regression modeling packages may not fully adhere to the stats package guidelines for implementing these functions. In such cases, overriding the method becomes necessary.

By design, the get_fitted_and_resid() method accepts a regression model object as input and returns a tibble (a modern presentation of the data.frame) with two columns: .fitted and .resid, representing the fitted values and residuals, respectively. If no input is supplied, the method uses the regression model object stored in the checker. Although modules in the autovi infrastructure make minimal assumptions about other modules, they do require strictly defined input and output formats to ensure data validation and prevent fatal bugs. Therefore, any overridden method should follow to these conventions.

checker$get_fitted_and_resid()
# A tibble: 50 × 2
   .fitted .resid
     <dbl>  <dbl>
 1   -1.85   3.85
 2   -1.85  11.8 
 3    9.95  -5.95
 4    9.95  12.1 
 5   13.9    2.12
 6   17.8   -7.81
 7   21.7   -3.74
 8   21.7    4.26
 9   21.7   12.3 
10   25.7   -8.68
# ℹ 40 more rows

Data Extraction

For linear regression model in R, the model frame contains all the data required by a formula for evaluation. This is essential for bootstrapping and refitting the model when constructing a bootstrapped distribution of VSS. Typically, the model frame can be extracted from the regression model object using the model.frame() generic function, which is the default method used by get_data(). However, some regression models do not use a formula or are evaluated differently, potentially lacking a model frame. In such cases, users can either provide the data used to fit the regression model through the data argument when constructing the checker, or customize the method to better suit their needs. It’s worth noting that this module is only necessary if bootstrapping is required, as the model frame is not used in other modules of the infrastructure.

The get_data() method accepts a regression model object as input and returns a data.frame representing the model frame of the fitted regression model. If no input is supplied, the regression model stored in the checker will be used.

checker$get_data() |> 
  head()
  dist speed
1    2     4
2   10     4
3    4     7
4   22     7
5   16     8
6   10     9

Bootstrapping and Model Refitting

Bootstrapping a regression model typically involves sampling the observations with replacement and refitting the model with the bootstrapped data. The boot_method() method follows this bootstrapping scheme by default. It accepts a fitted regression model and a data.frame as inputs, and returns a tibble of bootstrapped residuals. If no inputs are provided, the method uses the regression model stored in the checker and the result of the get_data() method.

Note that instead of calling get_data() implicitly within the method, it is used as part of the default argument definition. This approach allows users to bypass the get_data() method entirely and directly supply a data.frame to initiate the bootstrap process. Many other methods in autovi adopt this principle when possible, where dependencies are explicitly listed in the formal arguments. This design choice enhances the reusability and isolation of modules, offers better control for testing, and simplifies the overall process.

checker$boot_method(data = checker$get_data())
# A tibble: 50 × 2
   .fitted .resid
     <dbl>  <dbl>
 1   27.0   -2.96
 2   38.8  -12.8 
 3   34.8   -8.82
 4   27.0  -13.0 
 5   11.2    4.76
 6   42.7   -2.68
 7   42.7   -2.68
 8   38.8  -18.8 
 9   38.8   15.2 
10   -4.47   6.47
# ℹ 40 more rows

Auxiliary Computation

As described in Chapter 3, in some cases, a residual plot alone may not provide enough information to accurately determine VSS. For instance, when the points in the residual plot have significant overlap, the trend and shape of the residual pattern can be difficult to discern. Including auxiliary variables, such as the number of observations, as additional inputs to the computer vision model can be beneficial. To address this, autovi includes internal functions within the checker that automatically detect the number of inputs required by the provided Keras model. If multiple inputs are necessary, the checker invokes the auxiliary() method to compute these additional inputs.

The auxiliary() method takes a data.frame containing fitted values and residuals as input and returns a data.frame with five numeric columns. These columns represent four scagnostics — “Monotonic”, “Sparse”, “Striped”, and “Splines” — calculated using the cassowaryr package, as well as the number of observations. This approach is consistent with the training process of the computer vision models described in Chapter 3. If no data.frame is provided, the method will default to retrieving fitted values and residuals by calling get_fitted_and_resid().

Technically, any Keras-implemented computer vision model can be adapted to accept an image as the primary input and additional variables as secondary inputs by adding a data pre-processing layer before the actual input layer. If users wish to override auxiliary(), the output should be a data.frame with a single row and the number of columns such that its concatenation matches the number of parameters for the corresponding layer in the supplied Keras model.

checker$auxiliary()
# A tibble: 1 × 5
  measure_monotonic measure_sparse measure_splines measure_striped     n
              <dbl>          <dbl>           <dbl>           <dbl> <int>
1            0.0621          0.470          0.0901            0.62    50

Null Residual Simulation

A fundamental element of the automated residual assessment described in Chapter 3 is comparing the VSS of null plots with that of the true residual plot. However, due to the variety of regression models, there is no universal method for simulating null residuals that are consistent with model assumptions. Fortunately, for classical normal linear regression models, null residuals can be effectively simulated using the residual rotation method, as outlined in Buja et al. (2009). This process involves generating random draws from a standard normal distribution, regressing these draws on the original predictors, and then rescaling the resulting residuals by the ratio of the residual sum of squares to the that of the original linear regression model. Other regression models, such as glm (generalized linear model) and gam (generalized additive model), generally cannot use this method to efficiently simulate null residuals. Therefore, it is recommended that users override the null_method() to suit their specific model. The null_method() takes a fitted regression model as input, defaulting to the regression model stored in the checker, and returns a tibble.

checker$null_method()
# A tibble: 50 × 2
   .fitted  .resid
     <dbl>   <dbl>
 1   -1.85  18.2  
 2   -1.85  -0.765
 3    9.95 -12.8  
 4    9.95  18.6  
 5   13.9    2.57 
 6   17.8    7.03 
 7   21.7  -11.1  
 8   21.7  -13.2  
 9   21.7  -12.6  
10   25.7    3.57 
# ℹ 40 more rows

Plotting

Plotting is a crucial aspect of residual plot diagnostics because aesthetic elements like marker size, marker color, and auxiliary lines impact the presentation of information. There are computer vision models trained to handle images captured in various scenarios. For example, the VGG16 model (Simonyan and Zisserman 2014) can classify objects in images taken under different lighting conditions and is robust to image rotation. However, data plots are a special type of image as the plotting style can always be consistent if controlled properly. Therefore, we assume computer vision models built for reading residual plots will be trained with residual plots of a specific aesthetic style. In this case, it is best to predict plots using the same style for optimal performance. The plotting method plot_resid() handles this aspect.

plot_resid() accepts a data.frame containing fitted values and residuals, along with several customization options: a ggplot theme, an alpha value to control the transparency of data points, a size value to set the size of data points, and a stroke value to define the thickness of data point edges. Additionally, it includes four Boolean arguments to toggle the display of axes, legends, grid lines, and a horizontal red line. By default, it replicates the style we used to generate the training samples for the computer vision models described in Chapter 3. In brief, the residual plot omits axis text and ticks, titles, and background grid lines, featuring only a red line at y = 0. It retains only the necessary components of a residual plot. If the computer vision model is trained with a different but consistent aesthetic style, plot_resid() should be overridden.

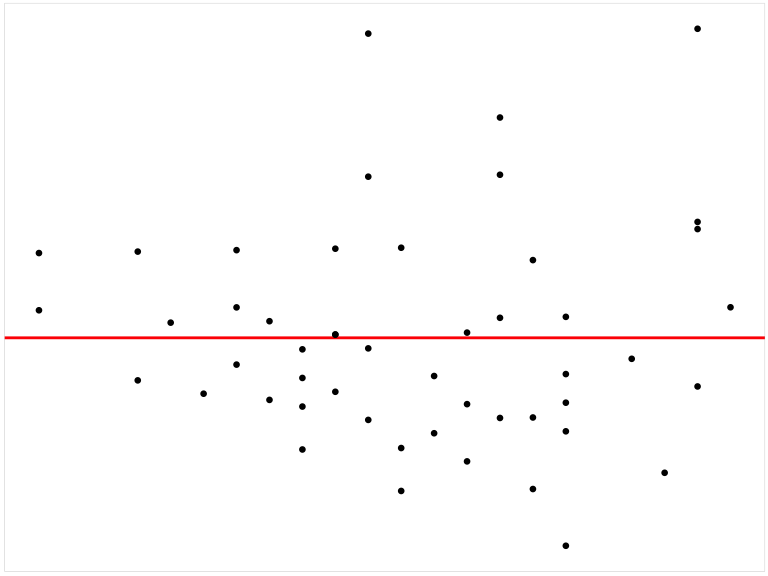
The method returns a ggplot object (Figure 4.4), which can be saved as a PNG file in the following module. If no data is provided, the method will use get_fitted_and_resid() to retrieve the fitted values and residuals from the regression model stored in the checker.

checker$plot_resid()
Figure 4.4: Residual plot of the regression model stored in the checker.

To manually generate true residual plots, null plots, or bootstrapped residual plots, you can pass the corresponding data.frame produced by the get_fitted_and_resid(), null_method(), and boot_method() methods to the plot_resid() method, respectively.

Plot Saving

Another key aspect of a standardized residual plot is its resolution. In Chapter 3, we used an image format of 420 pixels in height and 525 pixels in width. This resolution was chosen because the original set, consisting of 20 residual plots arranged in a four by five grid, was represented by an image of 2100 by 2100 pixels. The save_plot() method accepts a ggplot object as input and saves it as a PNG file to the location specified by the path argument. If no path is provided, the PNG file is saved to a temporary file.

checker$plot_resid() |> 
  checker$save_plot()
[1] "/var/folders/61/bv7_1qzs20x6fjb2rsv7513r0000gn/T//Rtmpmofl00/file128c71865dbe2.png"

Image Reading and Resizing

When training computer vision models, it is common to test various input sizes for the same architecture to identify the optimal setup. This involves preparing the original training image at a higher resolution than required and then resizing it to match the input size during training. The autovi package includes a class, KERAS_WRAPPER, to simplify this process. This Keras wrapper class features a method called image_to_array(), which reads an image as a PIL image using the pillow Python package, resizes it to the target input size required by the Keras model, and converts it to a Numpy array.

To construct a KERAS_WRAPPER object, you need to provide the Keras model as the main argument. However, users generally do not need to interact with this class directly, as the autovi checker automatically invokes its methods when performing VSS predictions. The image_to_array() method takes the path to the image file, the target height, and the target width as inputs and returns a Numpy array. If not specified, the target height and target width will be retrieved from the input layer of the Keras model by the get_input_height() and get_input_width() method of KERAS_WRAPPER.

The following code example demonstrate the way to manually generate the true residual plot, save it as PNG file, and load it back as Numpy array.

wrapper <- keras_wrapper(keras_model = checker$keras_model)  
input_array <- checker$plot_resid() |> 
  checker$save_plot() |>
  wrapper$image_to_array()
input_array$shape
(1, 32, 32, 3)

Visual Signal Strength (VSS) Prediction

VSS, as discussed in Chapter 3, estimates the distance between the input residual plot and a theoretically good residual plot. It can be defined in various ways, much like different methods for measuring the distance between two points. This will not impact the autovi infrastructure as long as the provided Keras model can predict the intended measure.

There are several ways to obtain VSS from the checker, with the most direct being the vss() method. By default, this method predicts the VSS for the true residual plot. If a ggplot or a data.frame, such as null residuals generated by the null_method(), is explicitly provided, the method will use that input to predict VSS accordingly. Note that if a ggplot is provided, auxiliary inputs must be supplied manually via the auxiliary argument, as we assume that auxiliary variables can not be computed directly from a ggplot.

Another way to obtain VSS is by calling the check() method. This comprehensive method perform extensive diagnostics on the true residual plot and store the VSS in the check_result field of the checker. Additionally, for obtaining VSS for null residual plots and bootstrapped residual plots, there are two specialized methods, null_vss() and boot_vss(), designed for this purpose respectively.

Calling the vss() method without arguments will predict the VSS for the true residual plot and return the result as a single-element tibble.

checker$vss()
# A tibble: 1 × 1
    vss
  <dbl>
1  3.16

Providing a data.frame of null residuals or a null residual plot yields the same VSS.

null_resid <- checker$null_method()
checker$vss(null_resid)
# A tibble: 1 × 1
    vss
  <dbl>
1  1.02
null_resid |>
  checker$plot_resid() |>
  checker$vss()
# A tibble: 1 × 1
    vss
  <dbl>
1  1.02

The null_vss() helper method primarily takes the number of null plots as input. If the user wants to use a ad hoc null simulation scheme, it can be provided via the null_method argument. Intermediate results, including null residuals and null plots, can be returned by enabling keep_null_data and keep_null_plot. The VSS, along with null residuals and null plots, will be stored in a tibble with three columns. The following code example demonstrates how to predict the VSS for five null residual plots while keeping the intermediate results.

checker$null_vss(5L, 
                 keep_null_data = TRUE, 
                 keep_null_plot = TRUE)
# A tibble: 5 × 3
    vss data              plot  
  <dbl> <list>            <list>
1 1.35  <tibble [50 × 2]> <gg>  
2 0.629 <tibble [50 × 2]> <gg>  
3 1.77  <tibble [50 × 2]> <gg>  
4 1.91  <tibble [50 × 2]> <gg>  
5 1.71  <tibble [50 × 2]> <gg>  

The boot_vss() helper method is similar to null_vss(), with some differences in argument names. The following code example demonstrates how to predict the VSS for five bootstrapped residual plots while keeping the intermediate results.

checker$boot_vss(5L,
                 keep_boot_data = TRUE,
                 keep_boot_plot = TRUE)
# A tibble: 5 × 3
    vss data              plot  
  <dbl> <list>            <list>
1  1.26 <tibble [50 × 2]> <gg>  
2  3.35 <tibble [50 × 2]> <gg>  
3  3.16 <tibble [50 × 2]> <gg>  
4  2.87 <tibble [50 × 2]> <gg>  
5  2.54 <tibble [50 × 2]> <gg>  

p-value Computation

Once we have obtained the VSS from both the true residual plot and the null plots, we can compute the p-value. This p-value represents the ratio of plots with VSS greater than or equal to that of the true residual plot. We can perform this calculation using the check() method. The main inputs for this method are the number of null plots and the number of bootstrapped plots to generate. If you need to access intermediate residuals and plots, you can enable the keep_data and keep_plot options. The method stores the final result in the check_result field of the object. To obtain the p-value using the check() method, you can use the following code.

checker$check(boot_draws = 100L, null_draws = 100L)
checker$check_result$p_value
[1] 0.01980198

You can also check the p-value by printing the checker, which includes it in the summary report.

checker
── <AUTO_VI object>
Status:
 - Fitted model: lm
 - Keras model: UNKNOWN
    - Output node index: 1
 - Result:
    - Observed visual signal strength: 3.162 (p-value = 0.0198)
    - Null visual signal strength: [100 draws]
       - Mean: 1.42
       - Quantiles: 
          ╔═════════════════════════════════════════════════╗
          ║   25%    50%    75%    80%    90%    95%    99% ║
          ║0.9296 1.3095 1.7277 1.7810 2.2497 2.5835 3.1570 ║
          ╚═════════════════════════════════════════════════╝
    - Bootstrapped visual signal strength: [100 draws]
       - Mean: 2.623 (p-value = 0.05941)
       - Quantiles: 
          ╔══════════════════════════════════════════╗
          ║  25%   50%   75%   80%   90%   95%   99% ║
          ║2.144 2.770 3.160 3.256 3.444 3.589 3.705 ║
          ╚══════════════════════════════════════════╝
    - Likelihood ratio: 0.5334 (boot) / 0.02943 (null) = 18.12 

4.2.5 Summary Plots

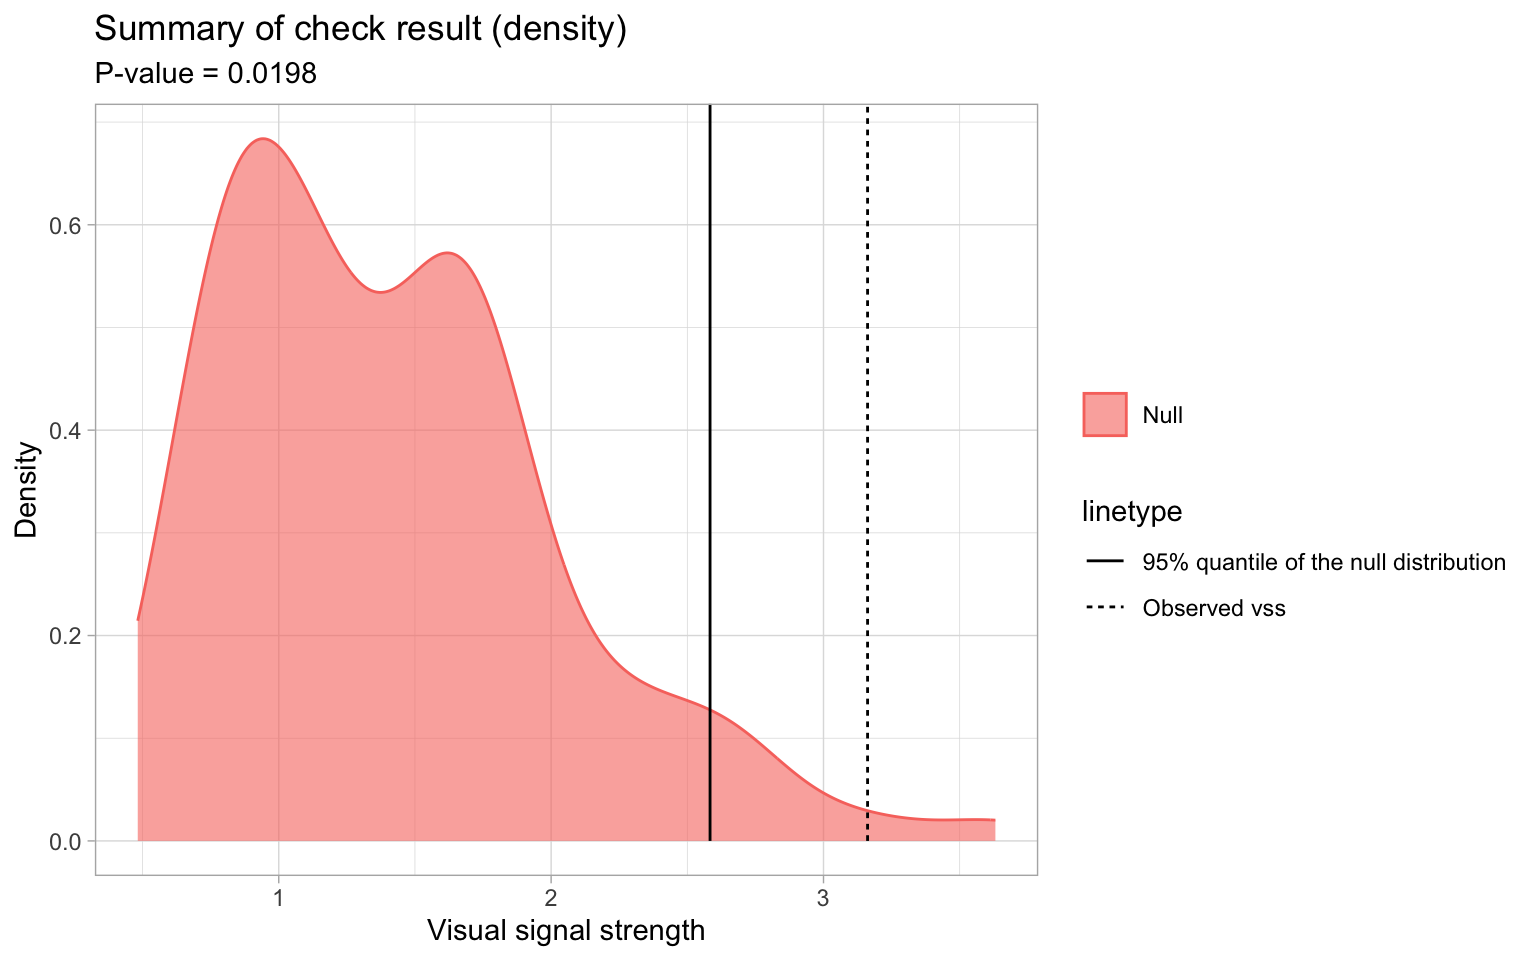
After executing the check() method, autovi offers two visualization options for the assessment result through the summary_plot() method, including the density plot and the rank plot. We have already discussed and interpreted the density plot in Section 4.2.3. Here, we would like to highlight the flexibility in choosing which elements to display in the density plot as shown in Figure 4.5. For instance, you can omit the bootstrapped distribution by setting boot_dist to NULL. Similarly, you can hide the null distribution (null_dist), the p-value (p_value), or the likelihood ratio (likelihood_ratio) as needed. The following example demonstrates how to create a summary plot without the results from bootstrapped plots.

checker$summary_plot(boot_dist = NULL,
                     likelihood_ratio = NULL)
Figure 4.5: Density plot of the VSS for null plots.

This customization allows you to focus on specific aspects of the assessment, tailoring the visualization to your analytical needs.

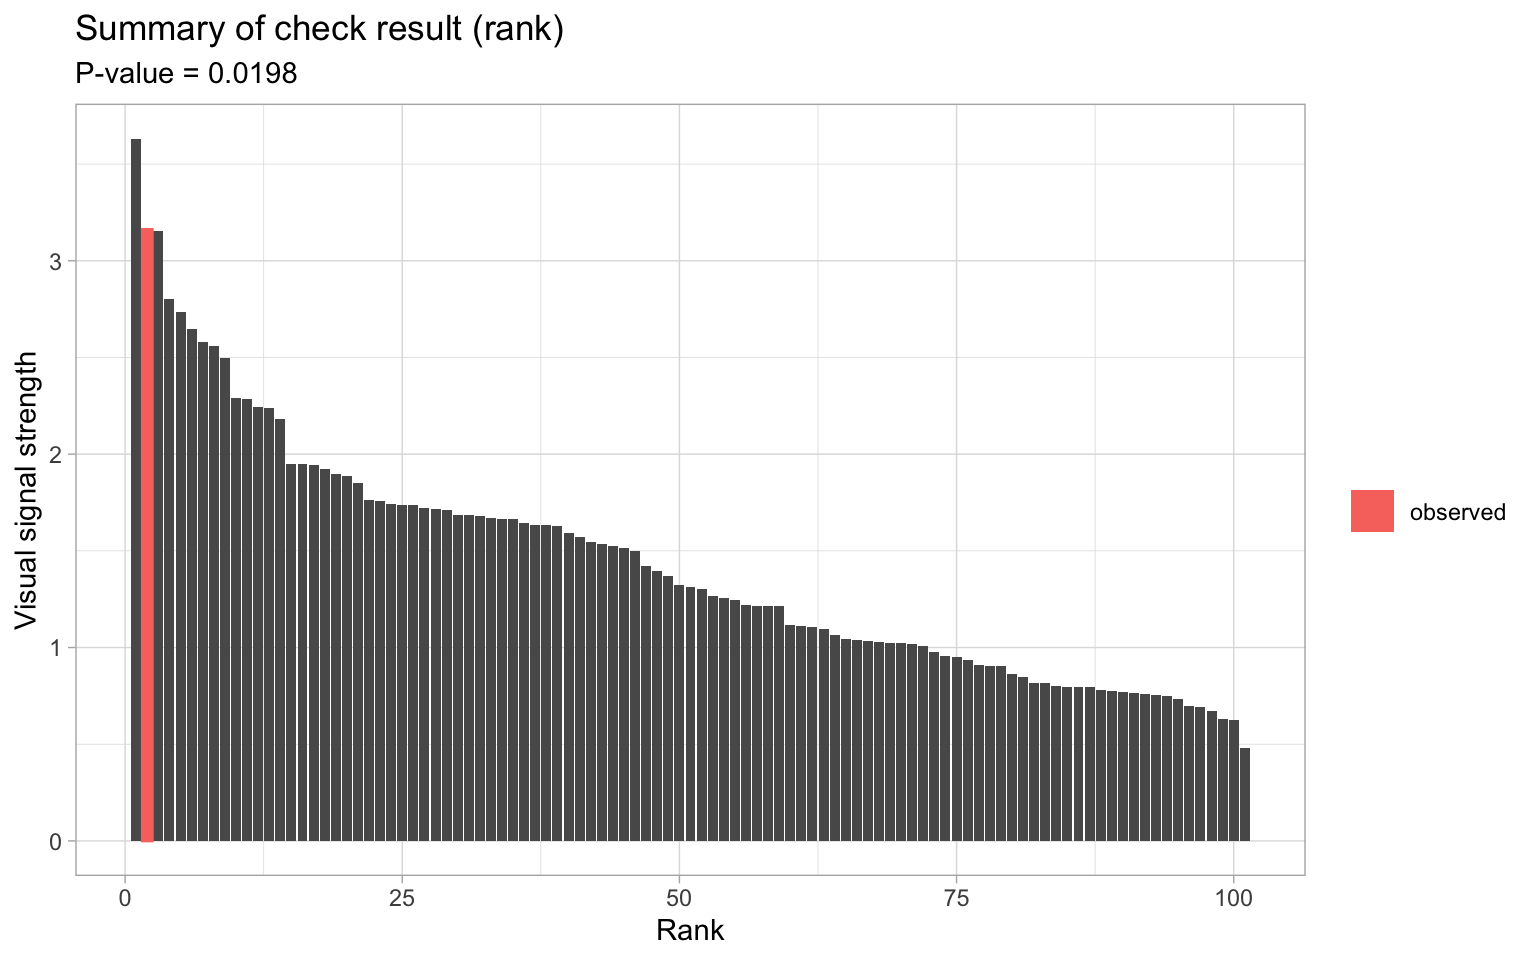
The rank plot (Figure 4.6), creating by setting type to “rank”, is a bar plot where the x-axis represents the rank and the y-axis shows the VSS. The bar that is coloured in red corresponding to the VSS of the true residual plot. By examining the rank plot, you can intuitively understand how the observed VSS compares to the null VSSs and identify any outliers in the null distribution.

checker$summary_plot(type = "rank")
Figure 4.6: Density plot of the VSS for null plots.

4.2.6 Feature Extraction

In addition to predicting VSS and computing p-values, autovi offers methods to extract features from any layer of the Keras model. To see which layers are available in the current Keras model, you can use the list_layer_name() method from the KERAS_WRAPPER class.

The following code example lists the layer names of the currently used Keras model:

wrapper <- keras_wrapper(checker$keras_model)
wrapper$list_layer_name()
 [1] "input_1"                  "tf.__operators__.getitem"
 [3] "tf.nn.bias_add"           "grey_scale"              
 [5] "block1_conv1"             "batch_normalization"     
 [7] "activation"               "block1_conv2"            
 [9] "batch_normalization_1"    "activation_1"            
[11] "block1_pool"              "dropout"                 
[13] "block2_conv1"             "batch_normalization_2"   
[15] "activation_2"             "block2_conv2"            
[17] "batch_normalization_3"    "activation_3"            
[19] "block2_pool"              "dropout_1"               
[21] "block3_conv1"             "batch_normalization_4"   
[23] "activation_4"             "block3_conv2"            
[25] "batch_normalization_5"    "activation_5"            
[27] "block3_conv3"             "batch_normalization_6"   
[29] "activation_6"             "block3_pool"             
[31] "dropout_2"                "block4_conv1"            
[33] "batch_normalization_7"    "activation_7"            
[35] "block4_conv2"             "batch_normalization_8"   
[37] "activation_8"             "block4_conv3"            
[39] "batch_normalization_9"    "activation_9"            
[41] "block4_pool"              "dropout_3"               
[43] "block5_conv1"             "batch_normalization_10"  
[45] "activation_10"            "block5_conv2"            
[47] "batch_normalization_11"   "activation_11"           
[49] "block5_conv3"             "batch_normalization_12"  
[51] "activation_12"            "block5_pool"             
[53] "dropout_4"                "global_max_pooling2d"    
[55] "additional_input"         "concatenate"             
[57] "dense"                    "dropout_5"               
[59] "activation_13"            "dense_1"                 

Among these layers, the “global_max_pooling2d” layer is a 2D global max pooling layer that outputs the results from the last convolutional blocks. As Simonyan and Zisserman (2014) noted, all preceding convolutional blocks can be viewed as a large feature extractor. Consequently, the output from this layer provides features that can be utilized for various purposes, such as performing transfer learning.

To obtain the features, provide the layer name using the extract_feature_from_layer argument in the predict() method. This will return a tibble with the VSS and all features extracted from that layer. Each row corresponds to one plot. The features will be flattened into 2D and named with the prefix “f_” followed by a number from one to the total number of features.

checker$plot_resid() |>
  checker$save_plot() |>
  wrapper$image_to_array() |>
  wrapper$predict(auxiliary = checker$auxiliary(),
                  extract_feature_from_layer = "global_max_pooling2d")
# A tibble: 1 × 257
    vss   f_1   f_2   f_3   f_4   f_5    f_6   f_7    f_8   f_9   f_10  f_11
  <dbl> <dbl> <dbl> <dbl> <dbl> <dbl>  <dbl> <dbl>  <dbl> <dbl>  <dbl> <dbl>
1  3.16 0.151     0     0     0     0 0.0203 0.109 0.0203     0 0.0834     0
# ℹ 245 more variables: f_12 <dbl>, f_13 <dbl>, f_14 <dbl>, f_15 <dbl>,
#   f_16 <dbl>, f_17 <dbl>, f_18 <dbl>, f_19 <dbl>, f_20 <dbl>, f_21 <dbl>,
#   f_22 <dbl>, f_23 <dbl>, f_24 <dbl>, f_25 <dbl>, f_26 <dbl>, f_27 <dbl>,
#   f_28 <dbl>, f_29 <dbl>, f_30 <dbl>, f_31 <dbl>, f_32 <dbl>, f_33 <dbl>,
#   f_34 <dbl>, f_35 <dbl>, f_36 <dbl>, f_37 <dbl>, f_38 <dbl>, f_39 <dbl>,
#   f_40 <dbl>, f_41 <dbl>, f_42 <dbl>, f_43 <dbl>, f_44 <dbl>, f_45 <dbl>,
#   f_46 <dbl>, f_47 <dbl>, f_48 <dbl>, f_49 <dbl>, f_50 <dbl>, f_51 <dbl>, …

Alternatively, the AUTO_VI class provides a way to extract features using the vss() method. This method is essentially a high-level wrapper around the predict() method of KERAS_WRAPPER, but it offers a more straightforward interface and better default arguments.

The results from the previous code example can be replicated with a single line of code as shown below.

checker$vss(extract_feature_from_layer = "global_max_pooling2d")
# A tibble: 1 × 257
    vss   f_1   f_2   f_3   f_4   f_5    f_6   f_7    f_8   f_9   f_10  f_11
  <dbl> <dbl> <dbl> <dbl> <dbl> <dbl>  <dbl> <dbl>  <dbl> <dbl>  <dbl> <dbl>
1  3.16 0.151     0     0     0     0 0.0203 0.109 0.0203     0 0.0834     0
# ℹ 245 more variables: f_12 <dbl>, f_13 <dbl>, f_14 <dbl>, f_15 <dbl>,
#   f_16 <dbl>, f_17 <dbl>, f_18 <dbl>, f_19 <dbl>, f_20 <dbl>, f_21 <dbl>,
#   f_22 <dbl>, f_23 <dbl>, f_24 <dbl>, f_25 <dbl>, f_26 <dbl>, f_27 <dbl>,
#   f_28 <dbl>, f_29 <dbl>, f_30 <dbl>, f_31 <dbl>, f_32 <dbl>, f_33 <dbl>,
#   f_34 <dbl>, f_35 <dbl>, f_36 <dbl>, f_37 <dbl>, f_38 <dbl>, f_39 <dbl>,
#   f_40 <dbl>, f_41 <dbl>, f_42 <dbl>, f_43 <dbl>, f_44 <dbl>, f_45 <dbl>,
#   f_46 <dbl>, f_47 <dbl>, f_48 <dbl>, f_49 <dbl>, f_50 <dbl>, f_51 <dbl>, …

The argument extract_feature_from_layer is also available in other functions that build on the vss() method, including null_vss(), boot_vss(), and check().

4.2.7 Trained Model Hosting

The trained computer vision models described in Chapter 3 are hosted on a GitHub repository at https://github.com/TengMCing/autovi_data. Currently, there are six models available. You can view them by calling list_keras_model(), which will return a tibble showing the input shape and a description of each model.

# A tibble: 6 × 11
  model_name  path          volume_path volume_size npz_path npz_py input_height
  <chr>       <chr>         <chr>             <int> <chr>    <chr>         <int>
1 vss_32      keras_model/… keras_mode…           4 keras_m… keras…           32
2 vss_64      keras_model/… keras_mode…           1 keras_m… keras…           64
3 vss_128     keras_model/… keras_mode…           8 keras_m… keras…          128
4 vss_phn_32  keras_model/… keras_mode…           2 keras_m… keras…           32
5 vss_phn_64  keras_model/… keras_mode…           8 keras_m… keras…           64
6 vss_phn_128 keras_model/… keras_mode…           8 keras_m… keras…          128
# ℹ 4 more variables: input_width <int>, input_channels <int>,
#   auxiliary_input_size <int>, description <chr>

The get_keras_model() function can be used to download a model to a temporary directory and load it into memory using TensorFlow. It requires only the model name, which is the value in the first column of the tibble returned by list_keras_model().

4.3 Web interface: autovi.web

The web interface package, called autovi.web, builds on autovi, and makes it easier for users easier to do automated residual plot assessment. It eliminates software installation issues, so users no longer need to struggle with managing Python environments or installing and maintaining the correct versions of R libraries. The interface is cross-platform, accessible on different devices and operating systems, and for users without R programming knowledge. The additional benefit is that updates can be controlled centrally so that users will always have the latest features.

The web interface autovi.web is available at autoviweb.netlify.app. The implementation discussed in this chapter is based on autovi.web version 0.1.0.

4.3.1 Implementation

The package autovi.web is built using the shiny (Chang et al. 2022) and shinydashboard (Chang and Borges Ribeiro 2021) R packages. Hosted on the shinyapps.io domain, the application is accessible through any modern web browser. The R packages htmltools (Cheng et al. 2024) and shinycssloaders (Sali and Attali 2020) are used to render markdown documentation in shiny application, and for loading animations for shiny widgets, respectively.

Determining the best way to implement the interface was difficult. In our initial planning for autovi.web, we considered implementing the entire web application using the webr framework (Moon 2020), which would have allowed the entire application to run directly in the user’s browser. However, this approach was not feasible at the time of writing this chapter. The reason is that one of the R packages autovi depends on the R package splancs (Rowlingson and Diggle 2023), which uses compiled Fortran code. A working Emscripten (Zakai 2011) version of this package, which would be required for webr, was not available.

We also explored the possibility of implementing the web interface using frameworks built on other languages, such as Python. However, server hosting domains that natively support Python servers typically do not have the latest version of R installed. Additionally, calling R from Python is typically done using the rpy2 Python library (Gautier 2024), but this approach can be awkward when dealing with language syntax related to non-standard evaluation. Another option we considered was renting a server where we could have full control, such as those provided by cloud platforms like Google Cloud Platform (GCP) or Amazon Web Services (AWS). However, correctly setting up the server and ensuring a secure deployment requires significant expertise. Ultimately, the most practical solution was to use the shiny and shinydashboard frameworks, which are well-established in the R community and offer a solid foundation for web application development.

The server-side configuration of autovi.web is carefully designed to support its functionality. Most required Python libraries, including pillow and NumPy, are pre-installed on the server. These libraries are integrated into the Shiny application using the reticulate package, which provides an interface between R and Python.

Due to the resource allocation policy of shinyapps.io, the server enters a sleep mode during periods of inactivity, resulting in the clearing of the local Python virtual environment. Consequently, when the application “wakes up” for a new user session, these libraries need to be reinstalled. While this ensures a clean environment for each session, it may lead to slightly longer loading times for the first user after a period of inactivity.

In contrast to autovi, autovi.web does not use the native Python version of TensorFlow. Instead, it leverages TensorFlow.js, a JavaScript library that allows the execution of machine learning models directly in the browser. This choice enables native browser execution, enhancing compatibility across different user environments, and shifts the computational load from the server to the client-side. TensorFlow.js also offers better scalability and performance, especially when dealing with resource-intensive computer vision models on shinyapps.io.

While autovi requires downloading the pre-trained computer vision models from GitHub, these models in “.keras” file format are incompatible with TensorFlow.js. Therefore, we extract and store the model weights in JSON files and include them as extra resources in the Shiny application. When the application initializes, TensorFlow.js rebuilds the computer vision model using these pre-stored weights.

To allow communication between TensorFlow.js and other components of the Shiny application, the shinyjs R package is used. This package allows calling custom JavaScript code within the Shiny framework. The specialized JavaScript code for initializing TensorFlow.js and calling TensorFlow.js for VSS prediction is deployed alongside the Shiny application as additional resources.

4.3.2 Design

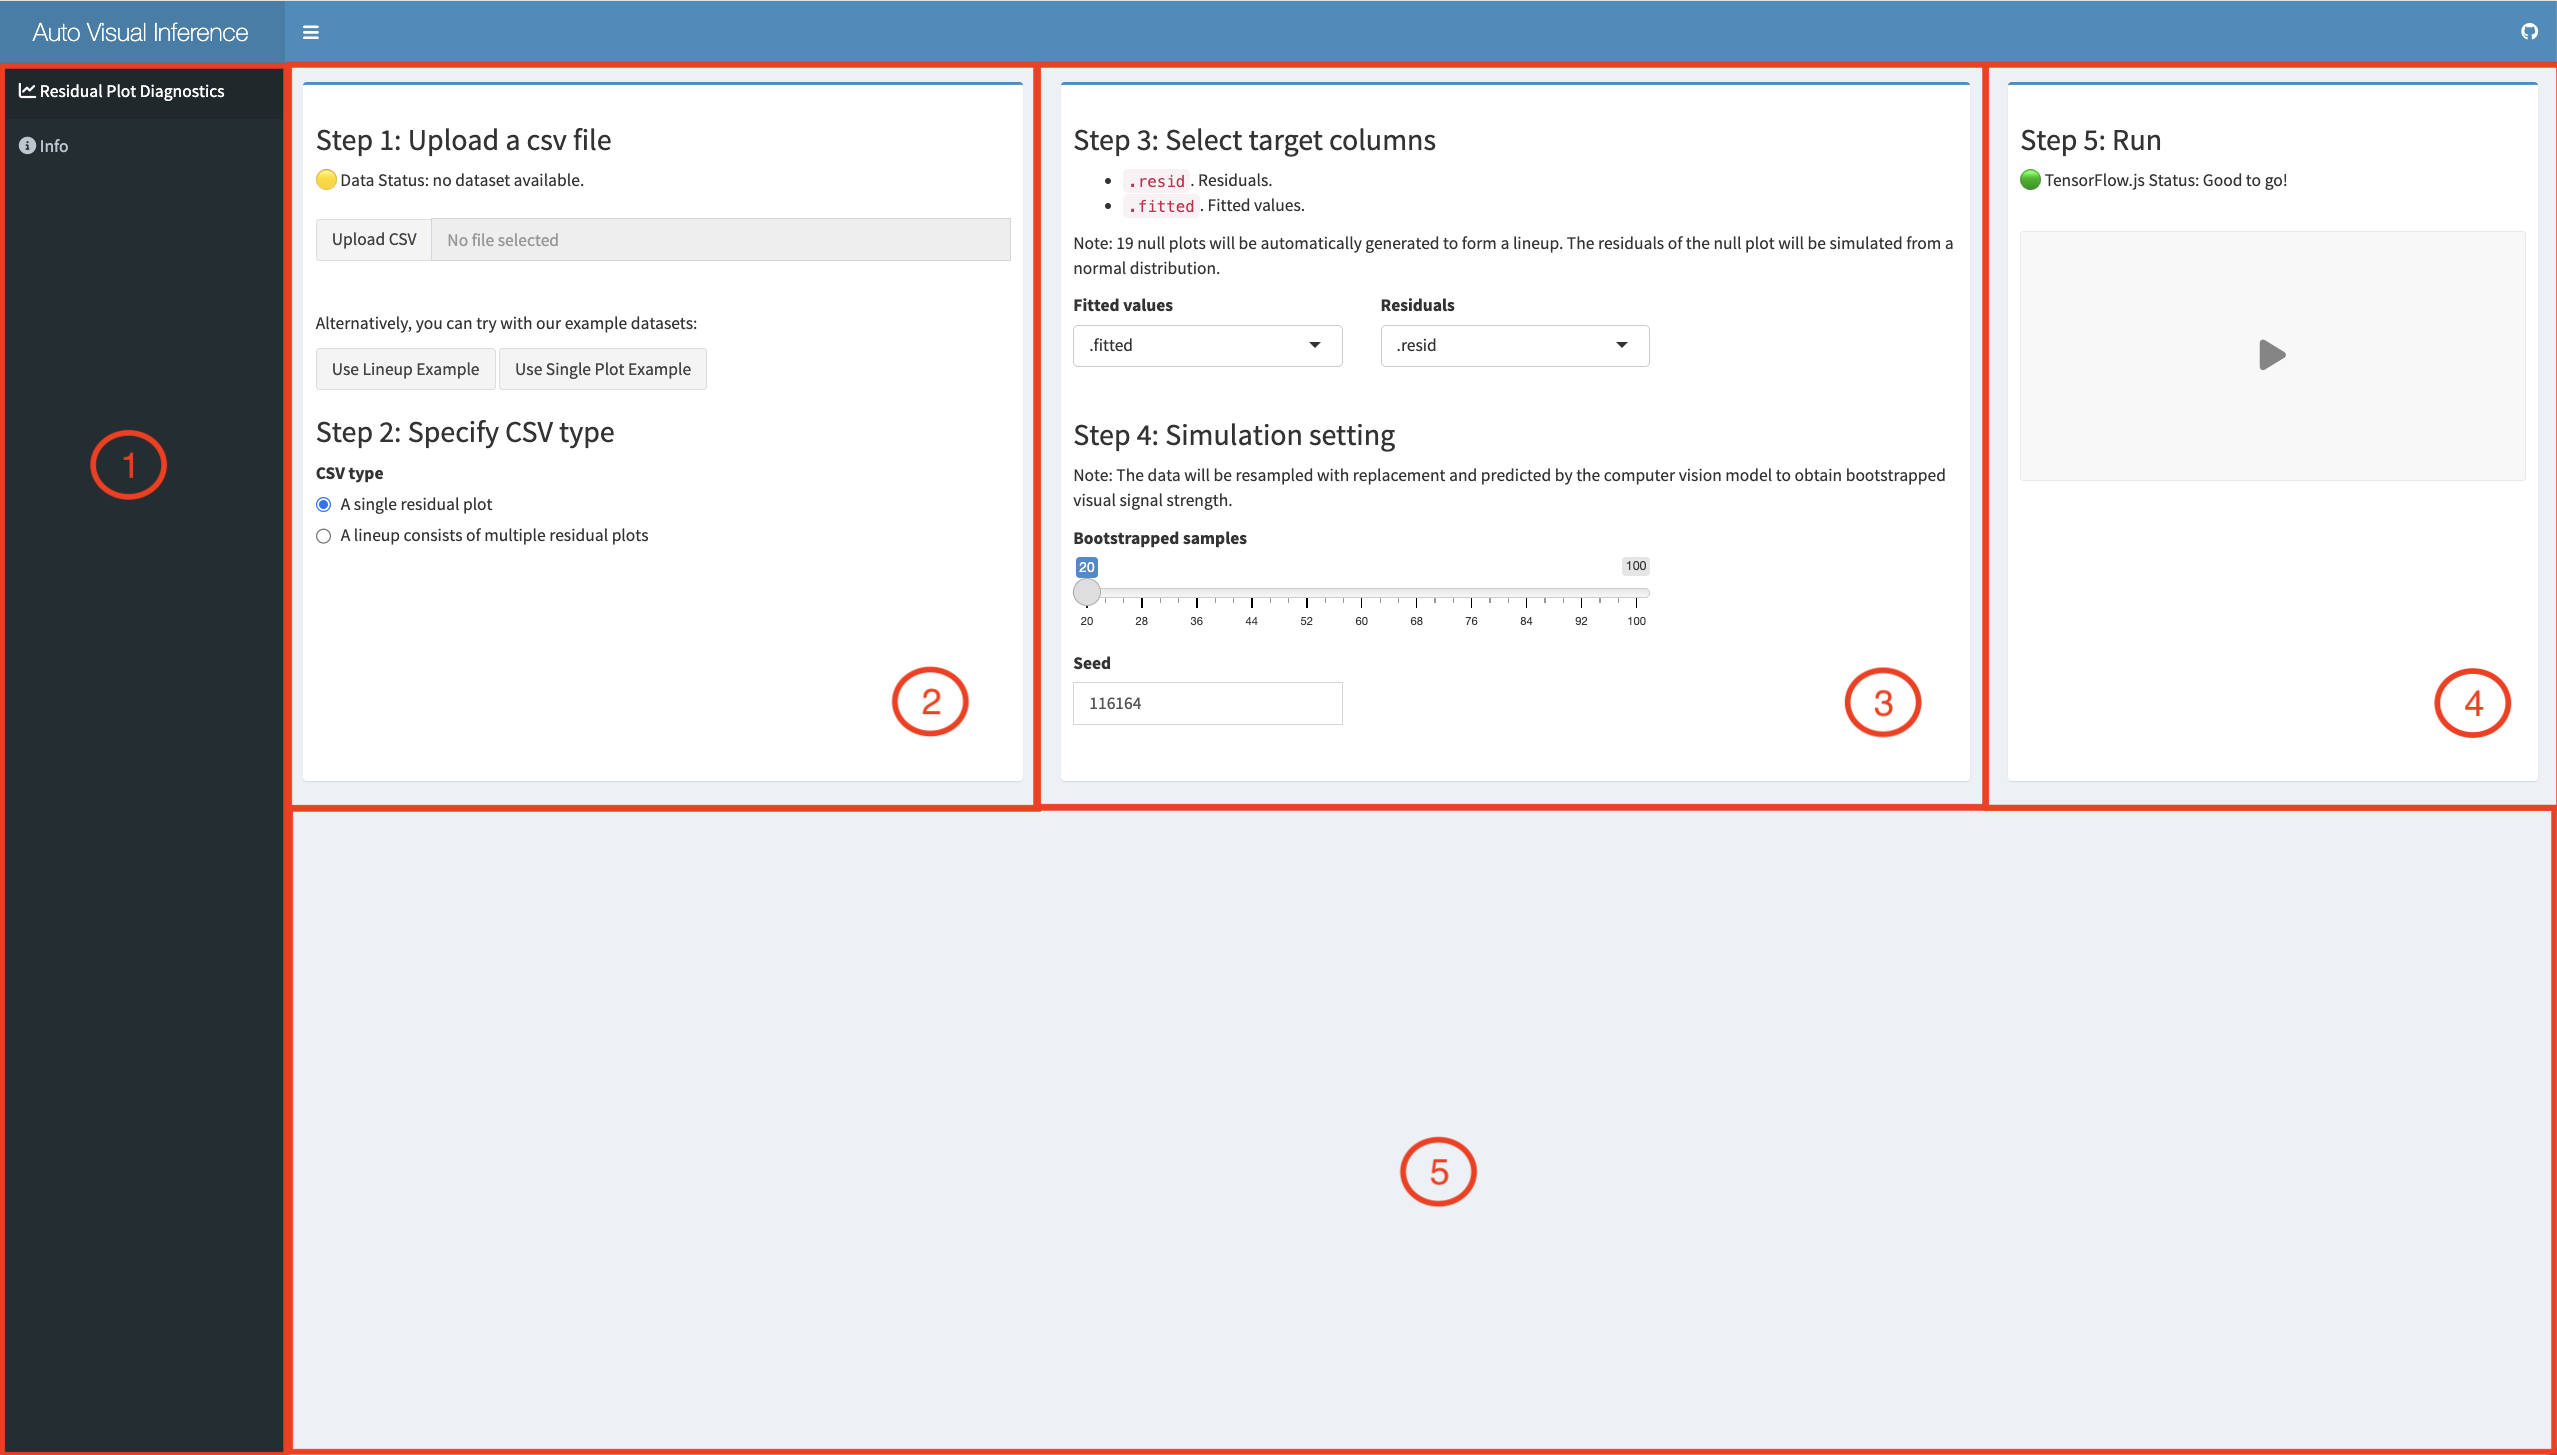
Figure 4.7: Overview of the autovi.web graphical user interface (GUI). This default view may change based on user interactions. Region 1 is the sidebar menu, containing the residual assessment tab and the information tab. Region 2 is the data upload panel, where users can provide a CSV file and specify the type of data it contains. Region 3 includes dropdown menus for selecting the columns to be analyzed, a slider to control the number of bootstrapping samples, and a numeric input box for setting the simulation seed. Region 4 displays the initialization status and offers a button to start the analysis. Region 5 is empty in the default view but will be populated with results once the analysis is started.

While the R package autovi aims to provide tools that can be extended to broader visual inference applications, autovi.web is only focus on providing a straightforward and clean user interface. An overview of the graphical user interface of autovi.web is provided in Figure 4.7. This is the default view of the web application, and there are five regions that user can mainly interact with. Region 1 of Figure 4.7 is a sidebar menu which can switch between the analysis page and the information page. The analysis page is the focus of this section.

Region 2 of Figure 4.7 is a panel for data uploading and CSV type selection. Clicking the “upload CSV” button opens a window where the user can select a file from their local system. The data status displayed above the button provides information about the number of rows and columns in the current dataset. Additionally, there are two example datasets available beneath the “upload CSV” button: one is a lineup example using a CSV file with three columns, and the other is a single plot example using a CSV file with two columns. More details about these example datasets are be discussed in Section 4.3.3.

While the autovi package typically expects a fitted regression model object provided by the user, this approach is impractical for a web interface. Saving the R model object to the filesystem involves extra steps and requires users to have specific knowledge, which does not align with the goal of the web application. Moreover, the regression model object may contain sensitive, non-shareable data, making it unsuitable for uploading. Additionally, model objects are often unnecessarily large, containing extra information not needed for residual diagnostics. In contrast, a CSV file is easier to generate using various software programs, not just R. CSV files are widely accepted and can be easily viewed and modified using common desktop applications like Excel. They are generally less sensitive than raw data, as they exclude most information about the predictors.

The web application is designed to assess either a single residual plot or a lineup of residual plots. Therefore, it accepts only two types of CSV files: one with at least two columns representing the fitted values and residuals of a single residual plot, and another with at least three columns, where the additional column serves as the label or identifier for a lineup of multiple residual plots. For a single residual plot, 19 null plots are generated by simulating normal random draws from a distribution with the same variance as the original residual plot, and comparisons are made with the original residual plot. For a lineup, comparisons are made among the plots within the lineup. After uploading the CSV file, the user must select the correct format to ensure the web interface interprets the data correctly.

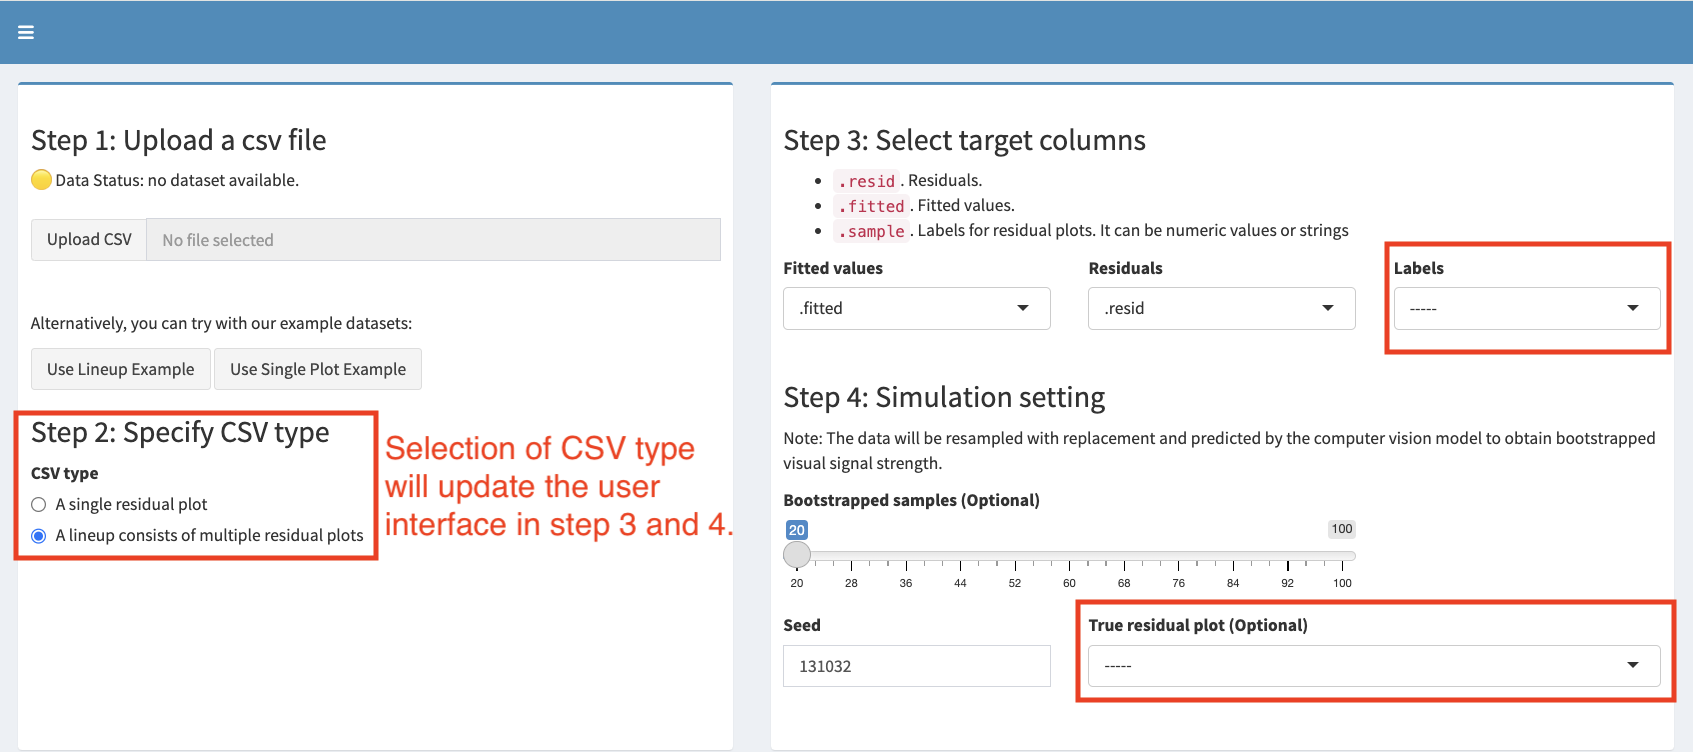
Figure 4.8: The panels for selecting target columns and simulation settings are updated when a different CSV type is selected in the left panel. Compared to Figure 4.7, where the CSV type is a single residual plot, choosing a CSV type that includes a lineup of multiple residual plots adds a dropdown menu for specifying a column for the residual plot identifier. Additionally, an optional dropdown menu for specifying the true residual plot identifier will appear under the simulation settings.

Region 3 of Figure 4.7 is a panel for column selection and simulation settings. As shown in Figure 4.7, if the CSV type is set to a single residual plot, there will be two dropdown menus for specifying the columns for fitted values and residuals, respectively. The default variable names for these columns are .fitted and .resid. After uploading the CSV file, the content of these dropdown menus will be updated to reflect the existing columns in the dataset. As displayed in Figure 4.8, for the CSV type that is a lineup of multiple residual plots, an additional dropdown menu will appear for specifying the column of residual plot labels. The default variable name for this column is .sample. If this variable name does not exist in the dataset, the dropdown menu will remain empty, allowing the user to specify the correct column. The number of levels for each option in this dropdown menu will be displayed to help avoid the selection of a variable with too many levels, which could significantly slow down the application due to extensive computation.

Under the simulation settings, there is a slider for specifying the number of bootstrapped samples needed for the assessment. A higher value on this slider will result in a more accurate bootstrap distribution estimation, though it will require more computation time. The simulation seed can be set in a numeric input box below the slider to control the reproducibility of the assessment. By default, a random seed is set each time the web page is refreshed. When the CSV type is a lineup of multiple residual plots, an optional dropdown menu will appear next to the simulation seed input box, allowing the user to specify an identifier for the true residual plot. If no label is provided for the true residual plot, the assessment will only estimate the VSS for each residual plot in the lineup, without providing a p-value, as it cannot be computed. Consequently, some result panels may be missing due to insufficient information. This option is useful when the lineup consists solely of null plots or if the user simply wants to obtain the VSS for multiple residual plots.

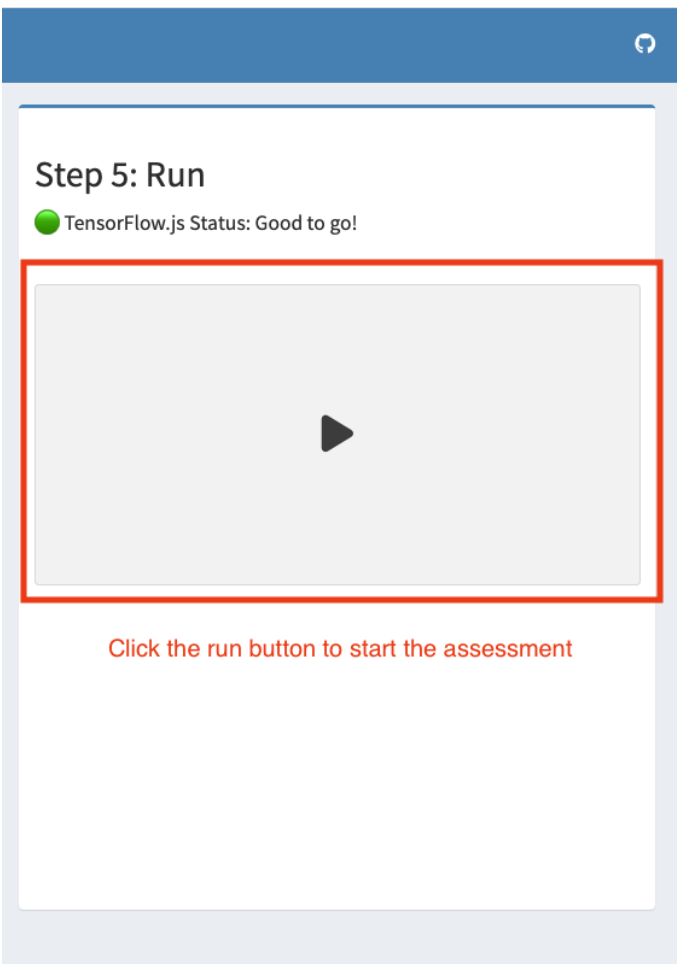
Region 4 of Figure 4.7 is the panel for triggering the assessment. It contains a large play button to start the assessment. Above the play button, a text message displays the status of TensorFlow.js, allowing users to monitor whether the JavaScript library and Keras model have been loaded correctly. The play button will remain disabled until both the data status in Region 1 and the TensorFlow.js status in Region 4 indicate that everything is ready, with both showing a green status.

Once the play button is clicked, region 5 of Figure 4.7 will be populated with panels displaying the assessment results. Generally, there will be four result panels, as shown in Figure 4.9 and Figure 4.10.

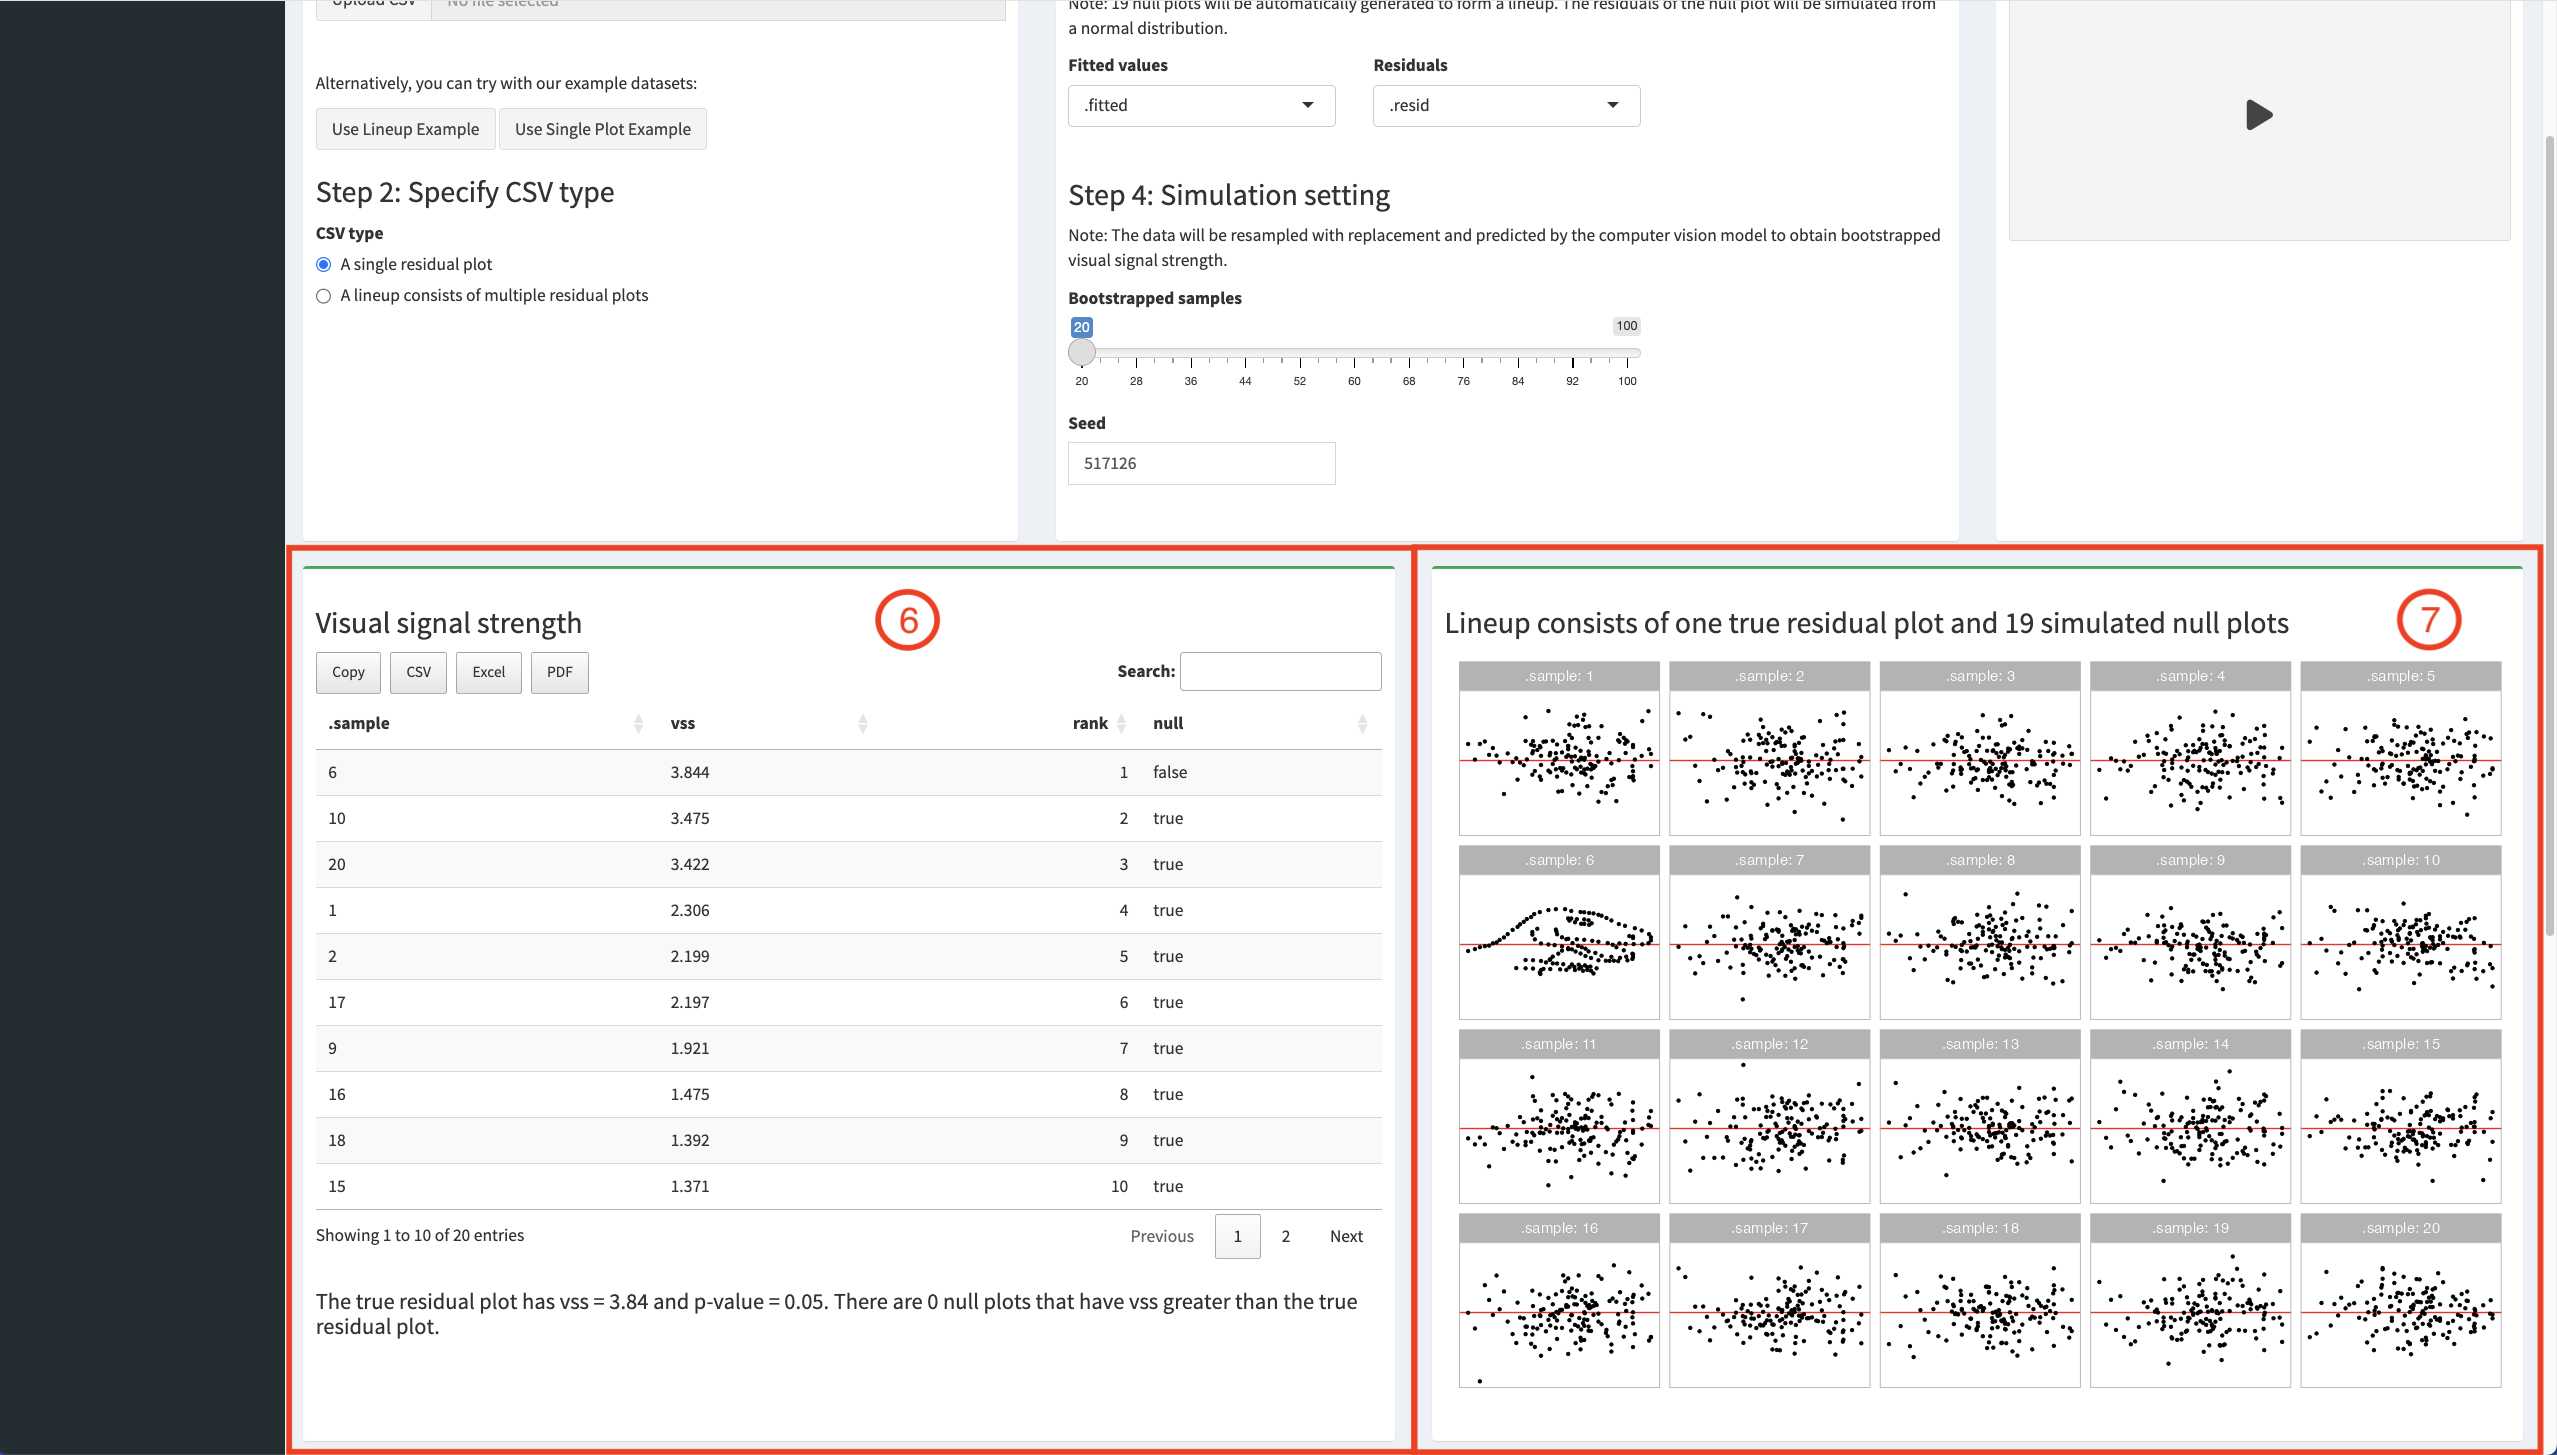
Figure 4.9: The first two panels of results from the automated residual assessment are shown. The application provides four results panels in total, and these screenshots display the first two. In region 1, there is an interactive table detailing the VSS, with a summary of the analysis provided in the paragraph below. Region 2 displays a lineup of residual plots.
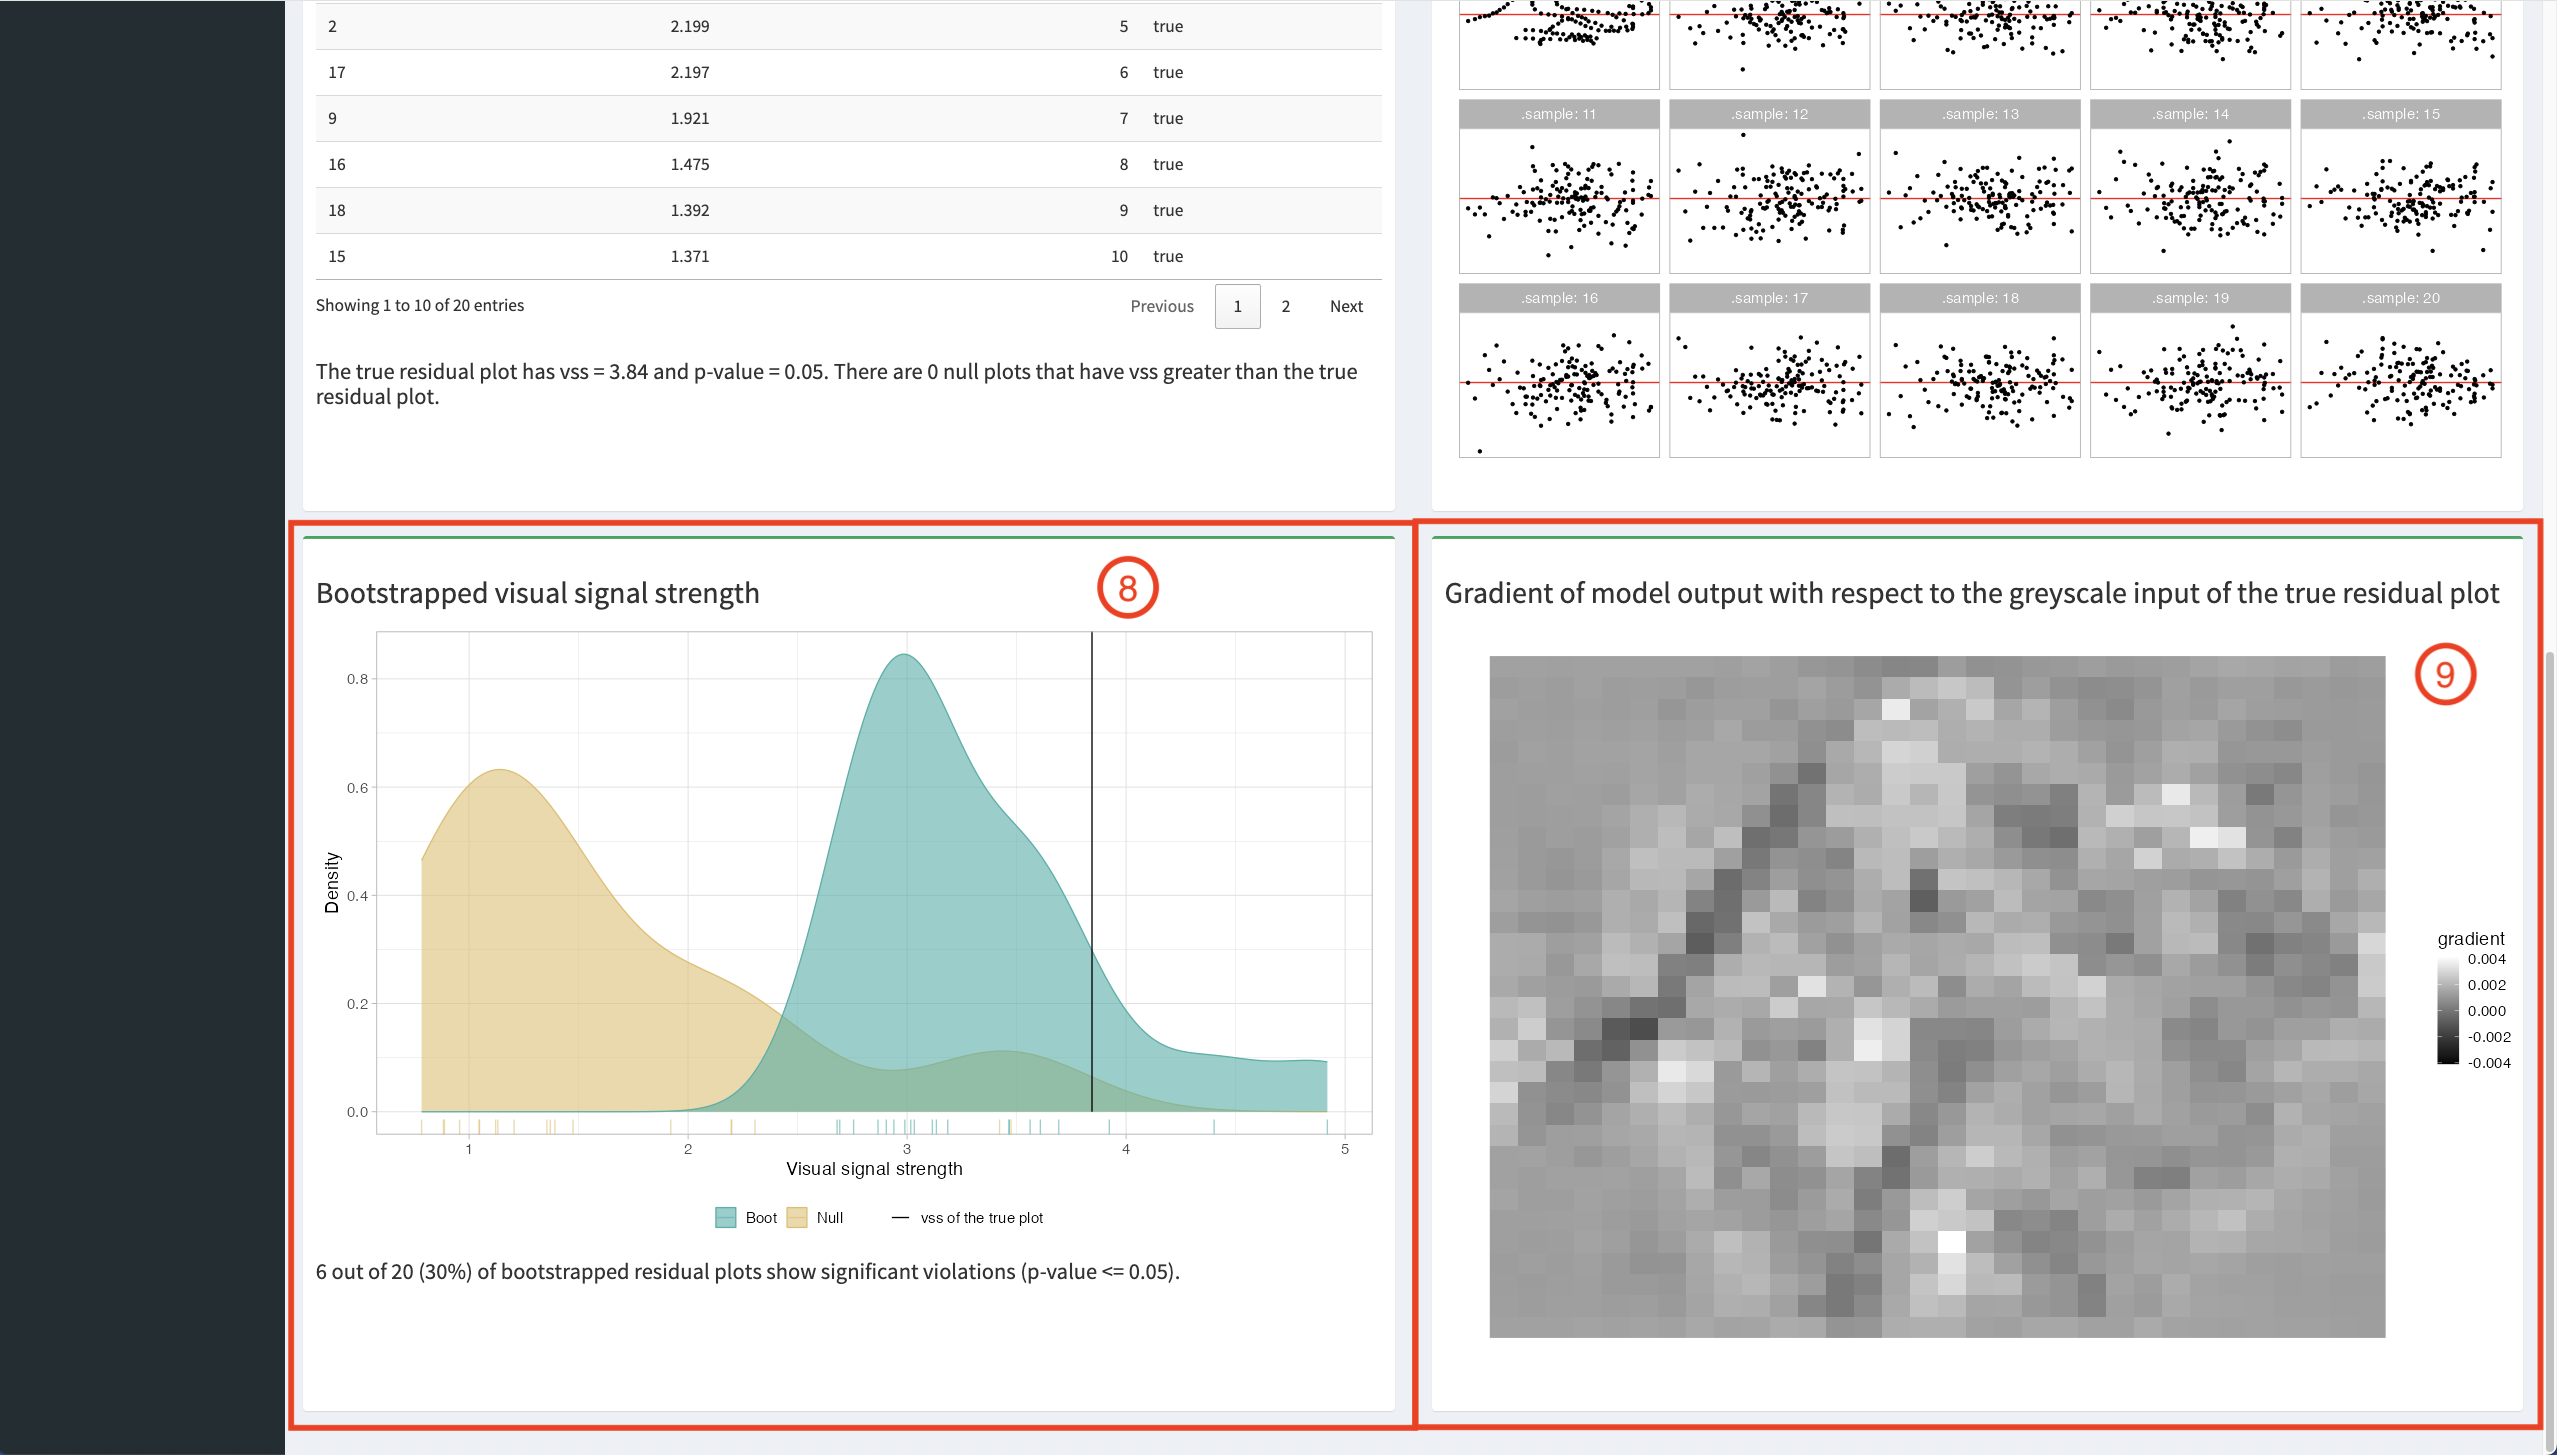
Figure 4.10: The last two panels of results from the automated residual assessment are shown. The application provides four results panels in total, and these screenshots display the final two. Region 1 presents a density plot comparing the bootstrapped VSS with the null VSS. Region 2 includes an attention map of the true residual plot.
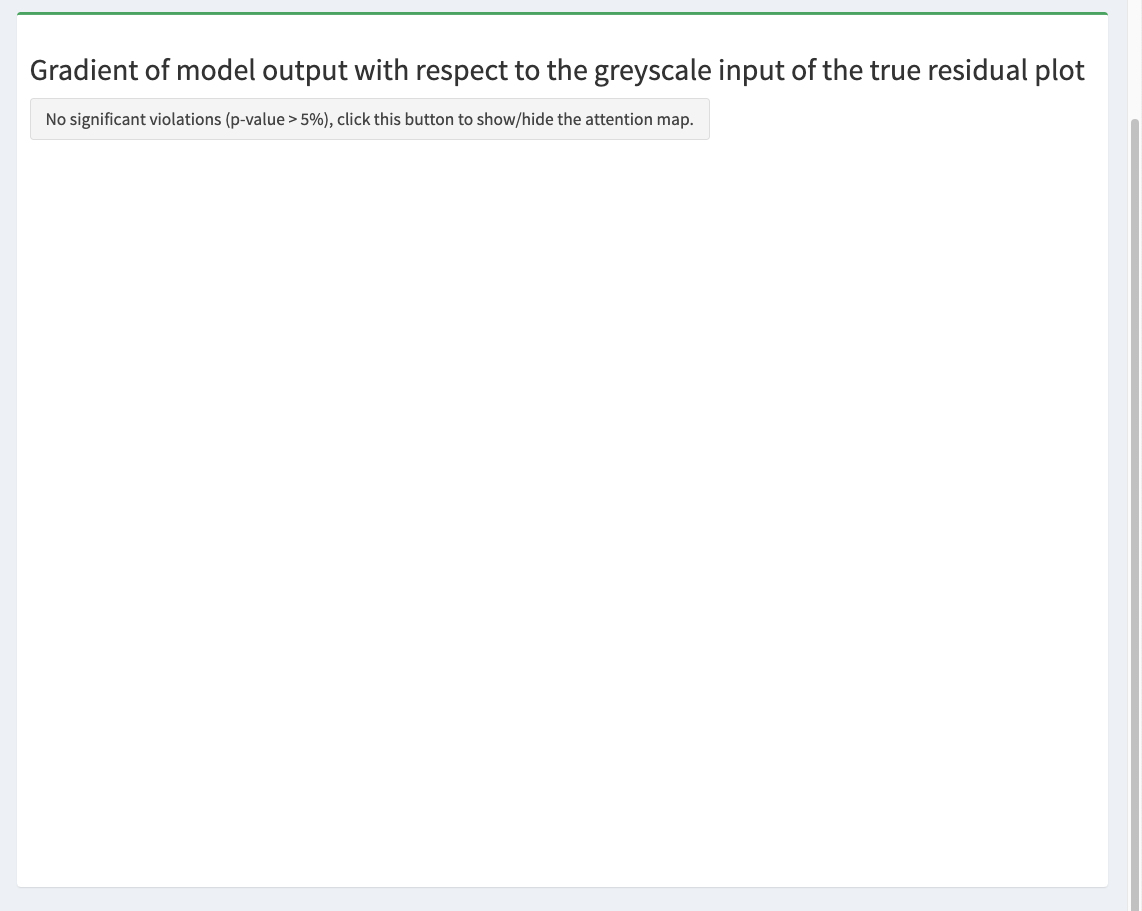
Figure 4.11: The attention map is hidden if the assessment indicates a p-value greater than 0.05. A button is available to toggle the display of the attention map.

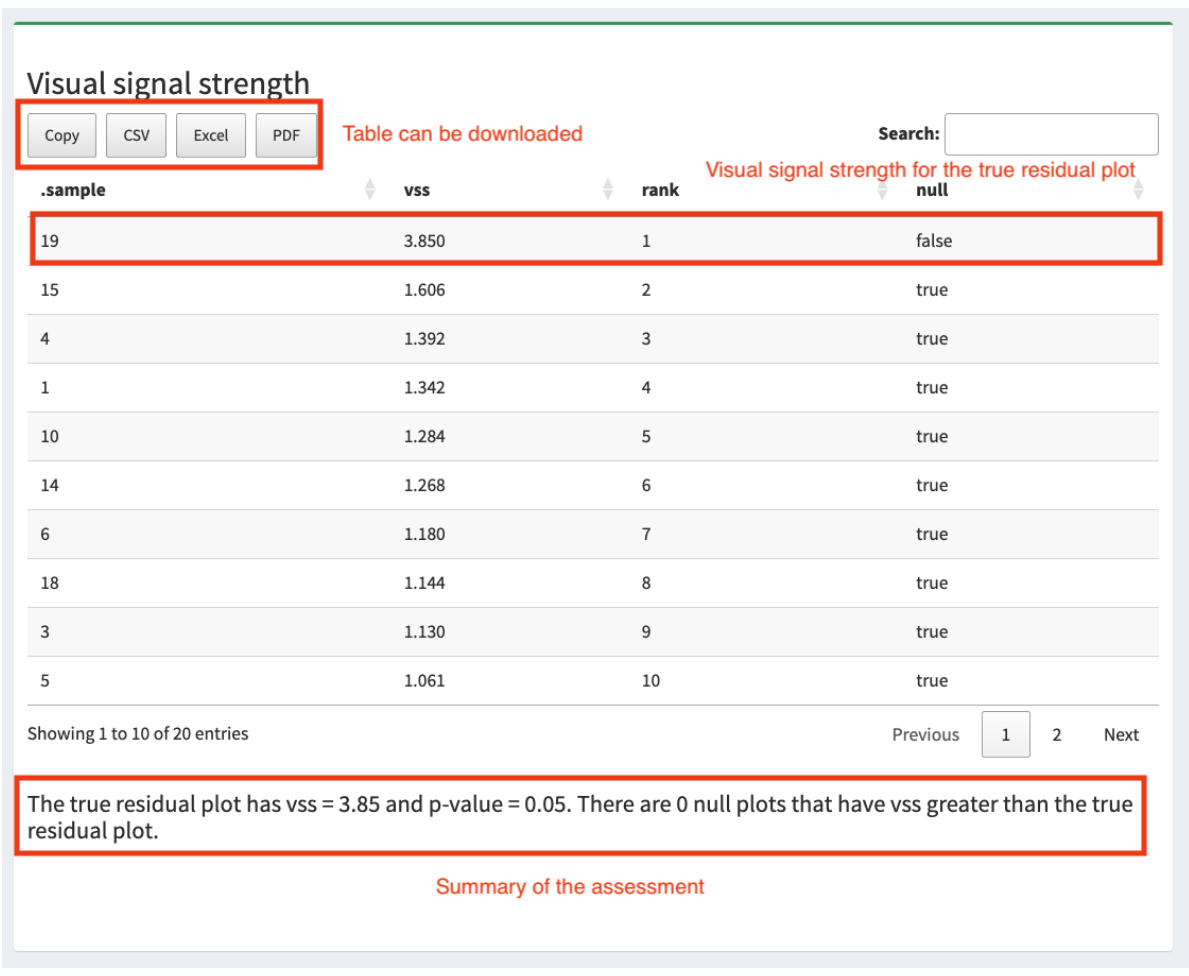
Region 6 of Figure 4.9 contains an interactive table created with the R package DT (Xie et al. 2024), which provides the VSS. This table includes four columns: .sample, vss, rank, and null. The .sample column shows the residual plot labels. For a CSV type that is a lineup, these labels are taken from an identifier column in the dataset specified by the user. In the case of the CSV type is a single residual plot, labels are automatically generated from 1 to 20, with the true residual plot receiving a randomly assigned label. The vss column displays the VSS for each residual plot, rounded to three decimal places. The rank column indicates the ranking of each residual plot based on VSS. The null column reveals whether the plot is a null plot. For the CSV type that is a single residual plot, only the true residual plot will have “false” in this column, while all other plots will be marked “true.” For the CSV type that is a lineup, if the true residual plot identifier has not been provided, this column will show “NA” to represent missing values. If the identifier is provided by user, the column behaves as if the CSV type is a single residual plot.

The DT table provides several interactive features. Users can download the table in four formats, including text, CSV, Excel, and PDF, using the buttons located above the table. Additionally, the table is searchable via the text input field also positioned above it. Below the table, a text message displays the p-value of the assessment for the true residual plot and summarizes the number of null plots with VSS greater than that of the true residual plot. This helps the user determine whether the true residual plot shows visual patterns that suggest model violations.

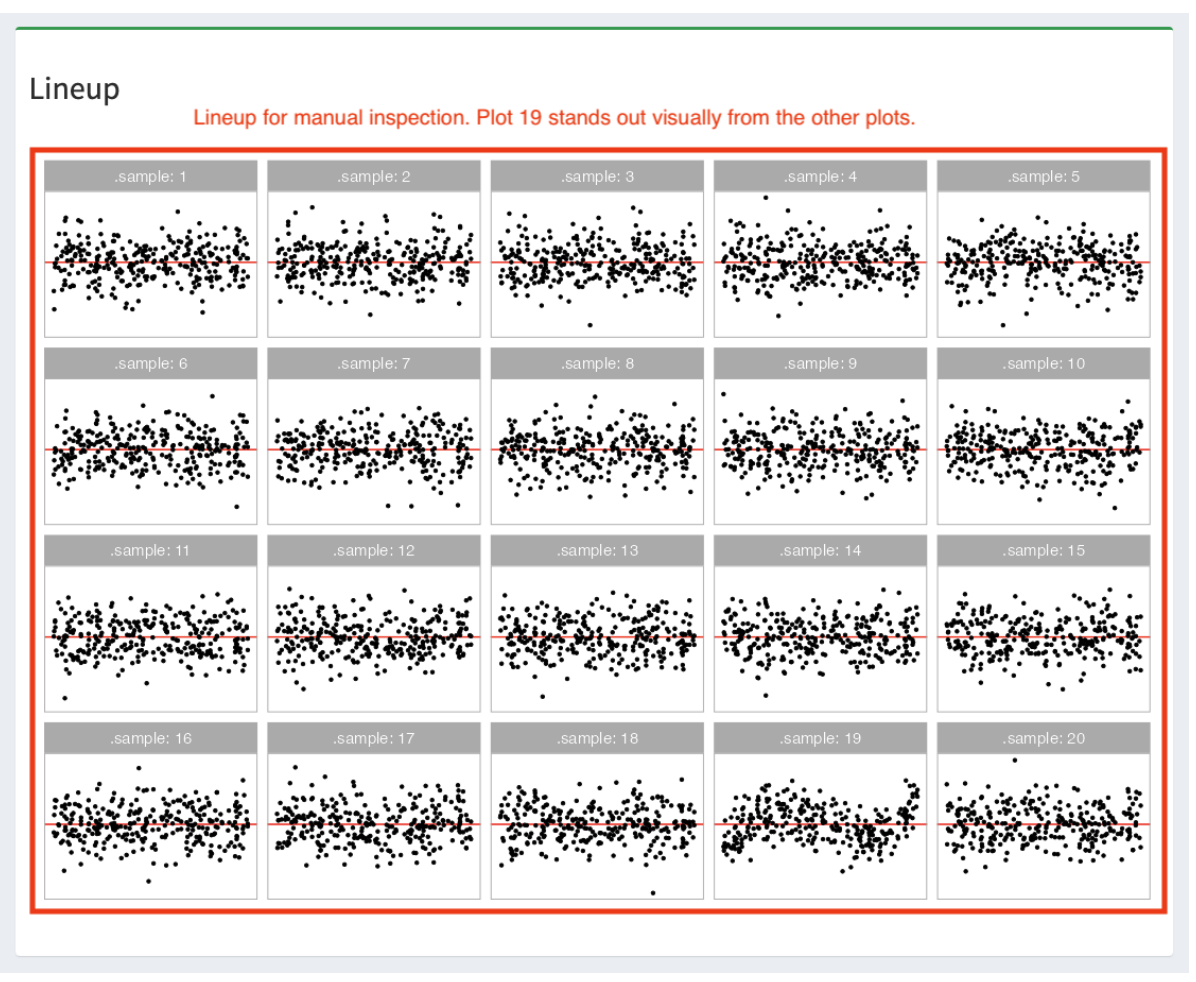
Region 7 of Figure 4.9 provides a lineup of plots corresponding to each .sample value from the table in Region 6. Due to space limitations, a maximum of 20 residual plots will be displayed, ensuring that the true residual plot, if known, will be included in the lineup. The plots are generated using ggplot2, the same as in autovi. Users can perform a visual test with this lineup to check if the true residual plot is distinguishable from the other plots, helping to determine the significance of model violations.

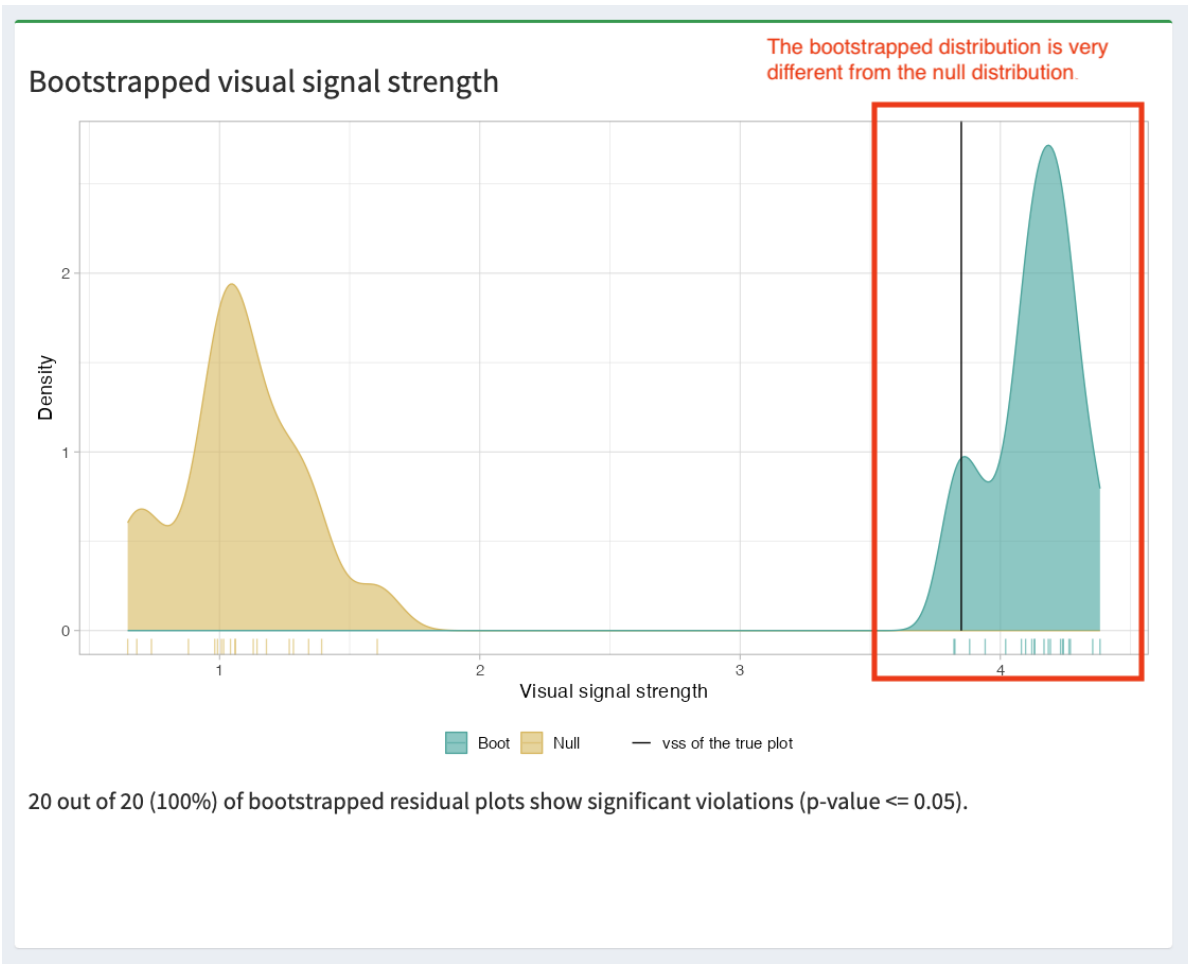
Region 8 of Figure 4.10 displays the density plot for bootstrapped VSS and null VSS. The densities are shown in distinct colors that are friendly for colorblind users. A solid vertical line marks the VSS of the true residual plot, while rug lines at the bottom of the plot provide a clearer view of individual cases. Below the plot, a text message indicates the number and percentage of bootstrapped residual plots that would be rejected by the visual test when compared to the null plots. Note that the bootstrapped residual plots in this application are generated differently from autovi. Since we do not have the R model object, we can not refit the regression model with bootstrapped data. Instead, we bootstrap the residuals of the true residual plot directly to obtain bootstrapped residual plots. As as result, this panel will disappear when the true residual plot is unknown.

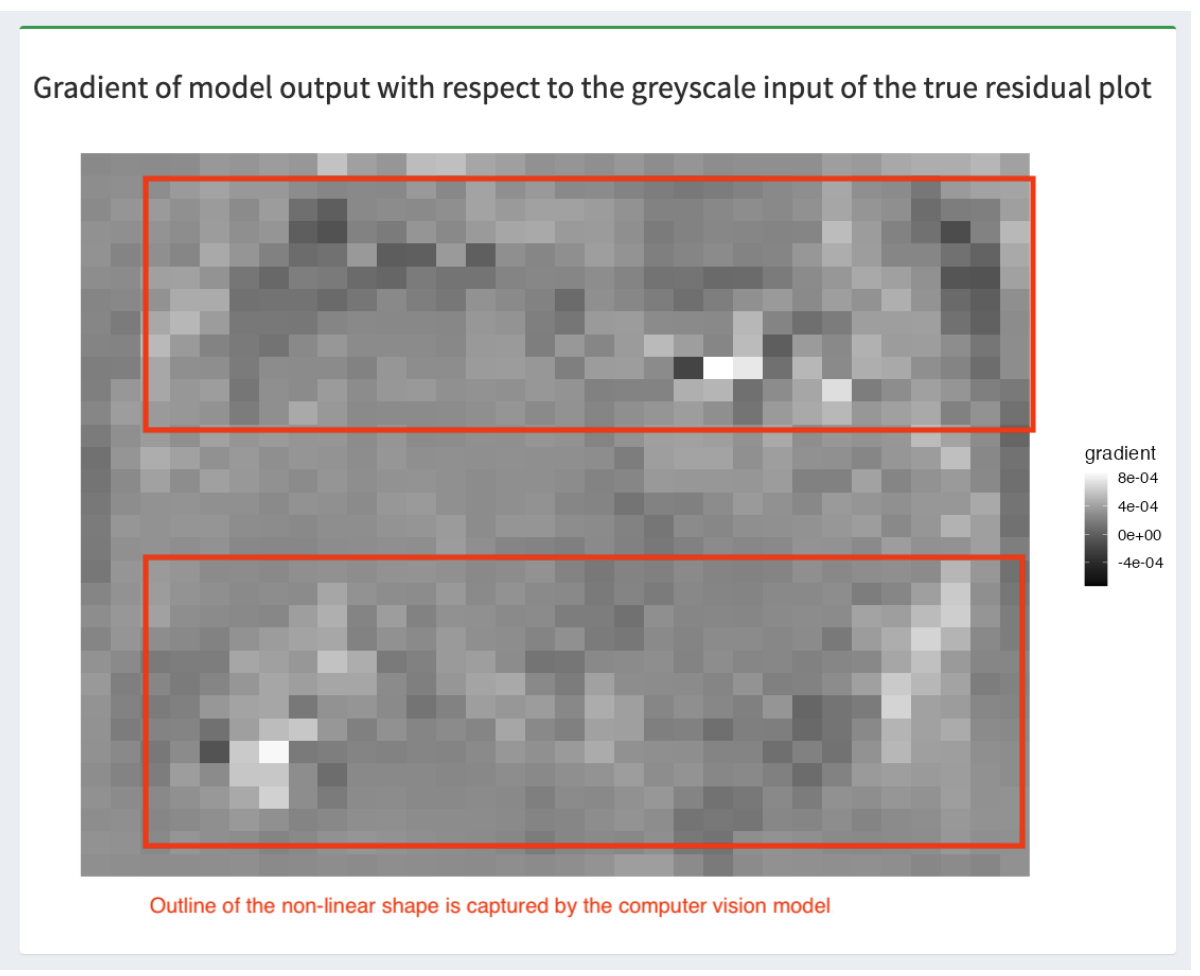
Region 9 of Figure 4.10 displays an attention map for the true residual plot, generated by computing the gradient of the Keras model’s output with respect to the greyscale input of the plot. The attention map helps to understand how the Keras model predicts VSS and which areas it is focusing on. We use a greyscale input because it is easier to generate a clear attention map in this format, and it usually conveys all the essential information, as most of the important details of the plot are drawn in black. If the p-value of the true residual plot is greater than 0.05, checking the attention map is not necessary. However, to provide users with the option to review it if they wish, a button will be available, as shown in Figure 4.11. This button allows users to toggle the display of the attention map.

4.3.3 Workflow

The workflow of autovi.web is designed to be straightforward, with numbered steps displayed in each panel shown in Figure 4.7. There are two example datasets provided by the web application, as mentioned in Section 4.3.2. The single residual plot example uses the dino dataset from the R package datasauRus (Davies et al. 2022). The lineup example uses residuals from a simulated regression model that has a non-linearity issue. We will walk through the lineup example to further demonstrate the workflow of the web application.

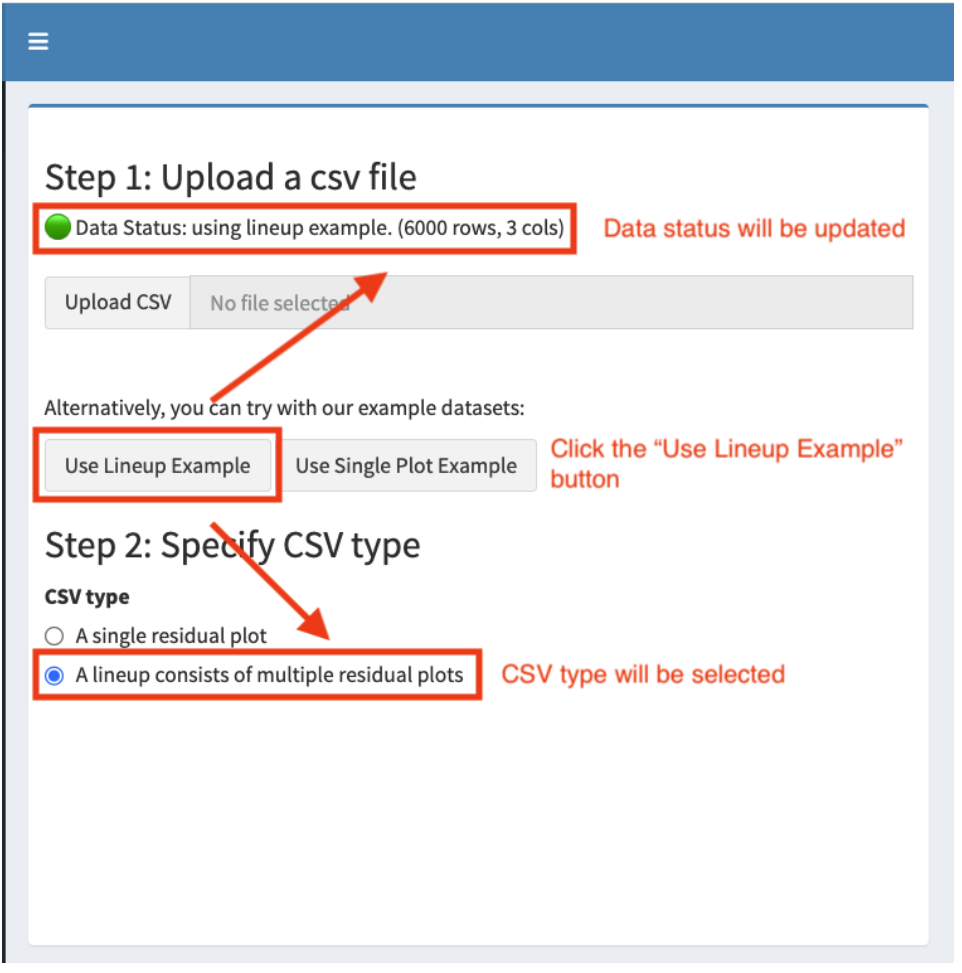
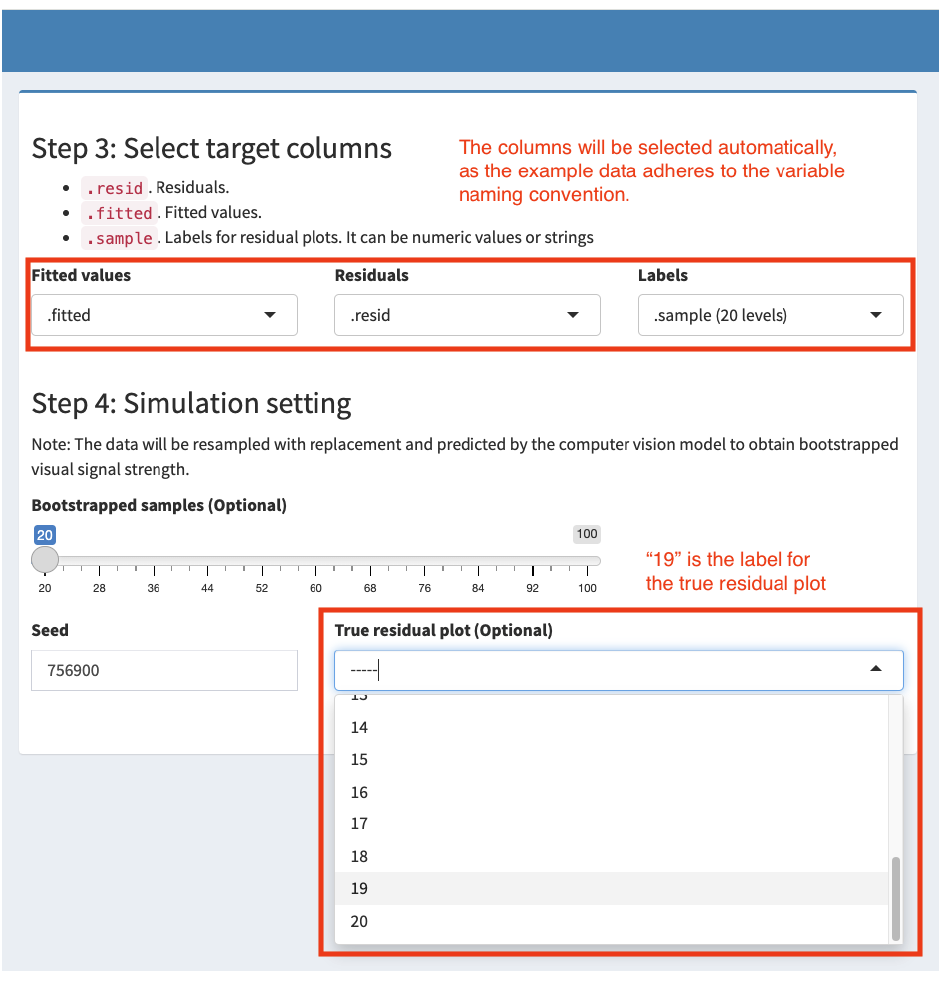
As shown in Figure 4.12, to use the lineup example data, click the “Use Lineup Example” button. The data status will then update to show the number of rows and columns in the dataset, and the CSV type will automatically be selected to the correct option. Since the example dataset follows the variable naming conventions assumed by the web application, the columns for fitted values, residuals, and labels of residual plots are set automatically (Figure 4.13). If the user is working with a custom dataset, these options must be set accordingly. Regardless of the dataset, the user must manually select the label for the true residual plot, as the web application allows assessments without this label. The next step is to click the play button to start the assessment.

Results are provided in multiple panels as displayed in Figure 4.14, Figure 4.15, Figure 4.16 and Figure 4.17. In Figure 4.14, the first row of the table is the most crucial to check, as it provides the VSS and the rank of the true residual plot among the other plots. The summary text beneath the table provides the p-value, which can be used for quick decision-making. In Figure 4.15, the lineup is for manual inspection, and the user should see if the true residual plot is visually distinguishable from the other plots, to confirm if the model violation is serious. The density plot in Figure 4.16 offers a more robust result, allowing the user to compare the distribution of bootstrapped VSS with the distribution of null VSS. Finally, the grayscale attention map shown in Figure 4.17 can be used to check if the target visual features, like the non-linearity present in the lineup example, are captured by the computer vision model, ensuring the quality of the assessment.

Figure 4.12: To begin the workflow for autovi using the lineup example dataset, the user clicks the “Use Lineup Example” button to load the example dataset, during which the data status and CSV type will be automatically updated.
Figure 4.13: After clicking the button in Figure 4.12, the target columns are selected automatically, though the user must manually select the label for the true residual plot, as the web application permits assessment without this label.
Figure 4.14: After finishing the required steps in Figure 4.12 and Figure 4.13, the user initiates the assessment of the lineup example data by clicking the run button.
Figure 4.15: The VSS of the true residual plot is displayed in the first row of the table, with a summary text beneath the table providing the p-value to aid in decision-making.
Figure 4.16: A lineup of residual plots allows for manual inspection.
Figure 4.17: The density plot helps verify if the bootstrapped distribution differs from the null distribution.
Figure 4.18: The attention map offers insights into whether the computer vision model has captured the intended visual features of the true residual plot.

4.4 Conclusions

This chapter presents new regression diagnostics software, the R package autovi and its accompanying web interface package, autovi.web. It addresses a critical gap in the current landscape of statistical software. While regression tools are widely available, effective and efficient diagnostic methods have lagged behind, particularly in the field of residual plot interpretation.

The autovi R package, introduced in this chapter, automates the assessment of residual plots by incorporating a computer vision model, eliminating the need for time-consuming and potentially inconsistent human interpretation. This automation improves the efficiency of the diagnostic process and promotes consistency in model evaluation across different users and studies.

The development of the accompanying Shiny app, autovi.web, expands access to these advanced diagnostic tools, by providing a user-friendly interface. It makes automated residual plot assessment accessible to a broader audience, including those who may not have extensive programming experience. This web-based solution effectively addresses the potential barriers to adoption, such as complex dependencies and installation requirements, that are often associated with advanced statistical software.

The combination of autovi and autovi.web offers a comprehensive solution to the challenges of residual plot interpretation in regression analysis. These tools have the potential to significantly improve the quality and consistency of model diagnostics across various fields, from academic research to industry applications. By automating a critical aspect of model evaluation, they allow researchers and analysts to focus more on interpreting results and refining models, rather than grappling with the intricacies of plot assessment.

The framework established by autovi and autovi.web opens up exciting possibilities for further research and development. Future work could explore the extension of these automated assessment techniques to other types of diagnostic plots and statistical models, potentially revolutionizing how we approach statistical inference using visual displays more broadly.

4.5 Availability

The web interface is housed at autoviweb.netlify.app.

The the current version of autovi can be installed from CRAN, and source code for both packages are available at https://github.com/TengMCing/.